ChartSeriesPointModel.Color Property
Specifies the point’s color.
Namespace: DevExpress.Blazor
Assembly: DevExpress.Blazor.v23.2.dll
NuGet Package: DevExpress.Blazor
Declaration
public Color Color { get; set; }Property Value
| Type | Description |
|---|---|
| Color | A point color. |
Remarks
A Chart point’s color is specified by the Color property. You can override this value for individual points. For this purpose, handle the CustomizeSeriesPoint event and use the PointAppearance.Color property to set the new color.
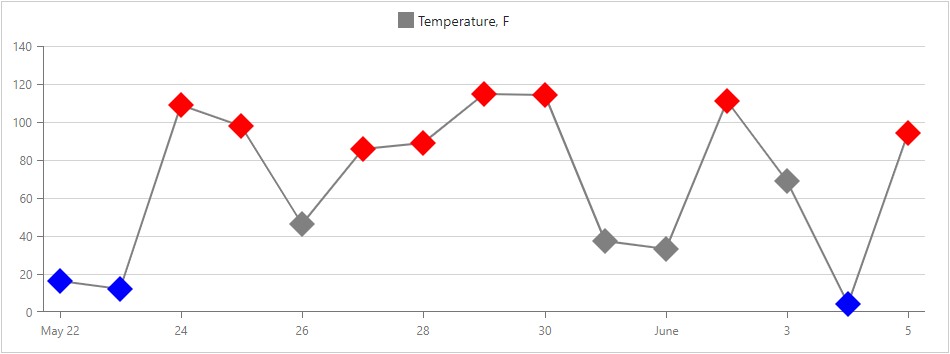
The example below demonstrates how to:
- use the DxChartSeriesPoint component to define the common point appearance;
- handle the CustomizeSeriesPoint event to change the color of points whose values are greater than 75 or less than 25.
<DxChart Data="@WeatherForecasts" CustomizeSeriesPoint="@PreparePointColor">
    <DxChartLineSeries AggregationMethod="@(i => (int)i.Average())"
                       Color="System.Drawing.Color.Gray"
                       ValueField="@((WeatherForecast i) => i.TemperatureF)"
                       ArgumentField="@(i => i.Date.Date)"
                       Name="Temperature, F">
        <DxChartSeriesPoint Symbol="ChartPointSymbol.Polygon" Color="System.Drawing.Color.Gray" Size="25" />
    </DxChartLineSeries>
    <DxChartLegend Position="RelativePosition.Outside" />
</DxChart>

@code {
    WeatherForecast[] WeatherForecasts;
    ...
    protected void PreparePointColor(ChartSeriesPointCustomizationSettings pointSettings) {
        double value = (double)pointSettings.Point.Value;
        if(value > 75)
            pointSettings.PointAppearance.Color = System.Drawing.Color.Red;
        else if(value < 25)
            pointSettings.PointAppearance.Color = System.Drawing.Color.Blue;
    }
}
See Also