Series.Legend Property
In This Article
Specifies a legend (or its View Model) that contains the series’ legend item.
Namespace: DevExpress.Xpf.Charts
Assembly: DevExpress.Xpf.Charts.v24.2.dll
NuGet Package: DevExpress.Wpf.Charts
#Declaration
#Property Value
| Type | Description |
|---|---|
| Object | An object of a legend’s View Model class or the Legend object. |
#Example
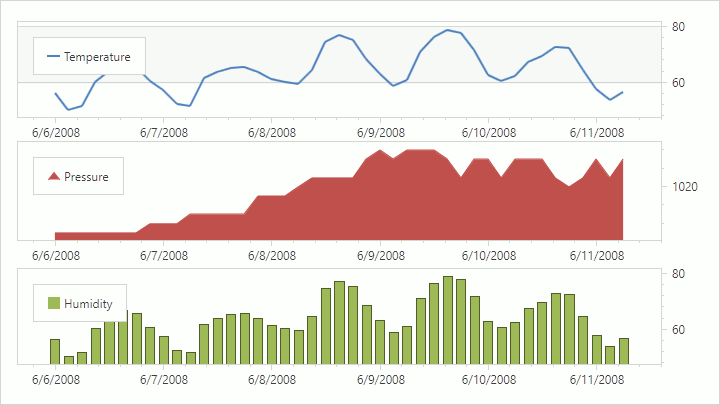
This example illustrates how to assign the chart control’s panes, axes, and legends to series:
Important
The series can use only elements that are defaults (for example, XYDiagram2D.
Markup:
<Window x:Class="LegendSample.MainWindow"
        xmlns="http://schemas.microsoft.com/winfx/2006/xaml/presentation"
        xmlns:x="http://schemas.microsoft.com/winfx/2006/xaml"
        xmlns:d="http://schemas.microsoft.com/expression/blend/2008"
        xmlns:mc="http://schemas.openxmlformats.org/markup-compatibility/2006"
        xmlns:dxc="http://schemas.devexpress.com/winfx/2008/xaml/charts"
        xmlns:viewmodel="clr-namespace:LegendSample.ViewModel"
        mc:Ignorable="d"
        Title="MainWindow" Height="720" Width="1280">
    <Window.DataContext>
        <viewmodel:WeatherViewModel/>
    </Window.DataContext>
    <Window.Resources>
        <Style TargetType="dxc:Range">
            <Setter Property="dxc:AxisY2D.AlwaysShowZeroLevel"
                    Value="False"/>
        </Style>
        <Style TargetType="dxc:Legend">
            <Setter Property="HorizontalPosition"
                    Value="Left"/>
        </Style>
    </Window.Resources>
    <Grid>
        <dxc:ChartControl DataSource="{Binding WeatherItems}" AutoLayout="False">
            <dxc:ChartControl.Legends>
                <dxc:Legend x:Name="temperatureLegend"
                            DockTarget="{Binding ElementName=temperaturePane}"/>
                <dxc:Legend x:Name="pressureLegend"
                            DockTarget="{Binding ElementName=pressurePane}"/>
                <dxc:Legend x:Name="humidityLegend"
                            DockTarget="{Binding ElementName=humidityPane}"/>
            </dxc:ChartControl.Legends>
            <dxc:ChartControl.Diagram>
                <dxc:XYDiagram2D>
                    <dxc:XYDiagram2D.AxisX>
                        <dxc:AxisX2D>
                            <dxc:AxisX2D.DateTimeScaleOptions>
                                <dxc:ManualDateTimeScaleOptions MeasureUnit="Hour"
                                                                MeasureUnitMultiplier="1"/>
                            </dxc:AxisX2D.DateTimeScaleOptions>
                        </dxc:AxisX2D>
                    </dxc:XYDiagram2D.AxisX>
                    <dxc:XYDiagram2D.AxisY>
                        <dxc:AxisY2D x:Name="temperatureAxisY"
                                     Alignment="Far"/>
                    </dxc:XYDiagram2D.AxisY>
                    <dxc:XYDiagram2D.DefaultPane>
                        <dxc:Pane x:Name="temperaturePane"/>
                    </dxc:XYDiagram2D.DefaultPane>
                    <dxc:XYDiagram2D.Panes>
                        <dxc:Pane x:Name="pressurePane"/>
                        <dxc:Pane x:Name="humidityPane"/>
                    </dxc:XYDiagram2D.Panes>
                    <dxc:XYDiagram2D.SecondaryAxesY>
                        <dxc:SecondaryAxisY2D x:Name="pressureAxisY"/>
                        <dxc:SecondaryAxisY2D x:Name="humidityAxisY"/>
                    </dxc:XYDiagram2D.SecondaryAxesY>
                    <dxc:XYDiagram2D.Series>
                        <dxc:LineSeries2D DisplayName="Temperature"
                                          ArgumentDataMember="DateTime" ValueDataMember="Temperature"
                                          AxisY="{Binding ElementName=temperatureAxisY}"
                                          Legend="{Binding ElementName=temperatureLegend}"
                                          Pane="{Binding ElementName=temperaturePane}"/>
                        <dxc:AreaSeries2D DisplayName="Pressure"
                                          ArgumentDataMember="DateTime" ValueDataMember="Pressure"
                                          AxisY="{Binding ElementName=pressureAxisY}"
                                          Legend="{Binding ElementName=pressureLegend}"
                                          Pane="{Binding ElementName=pressurePane}"/>
                        <dxc:BarSideBySideSeries2D DisplayName="Humidity"
                                                   BarWidth="2"
                                                   ArgumentDataMember="DateTime" ValueDataMember="Temperature"
                                                   AxisY="{Binding ElementName=humidityAxisY}"
                                                   Legend="{Binding ElementName=humidityLegend}"
                                                   Pane="{Binding ElementName=humidityPane}"/>
                    </dxc:XYDiagram2D.Series>
                </dxc:XYDiagram2D>
            </dxc:ChartControl.Diagram>
        </dxc:ChartControl>
    </Grid>
</Window>
Code-Behind:
class WeatherItem {
    public DateTime DateTime { get; }
    public double Temperature { get; }
    public double Pressure { get; }
    public double Humidity { get; }

    public WeatherItem(DateTime dateTime, double temperature, double pressure, double humidity) {
        this.DateTime = dateTime;
        this.Temperature = temperature;
        this.Pressure = pressure;
        this.Humidity = humidity;
    }
}

class WeatherViewModel {
    public IReadOnlyList<WeatherItem> WeatherItems { get; }

    public WeatherViewModel() {
        WeatherItems = new List<WeatherItem> {
            new WeatherItem(new DateTime(2008, 6, 11, 6, 0, 0, 0),  56.48, 1023, 69),
            new WeatherItem(new DateTime(2008, 6, 11, 3, 0, 0, 0),  53.78, 1021, 76),
            new WeatherItem(new DateTime(2008, 6, 11, 0, 0, 0, 0),  57.74, 1023, 66),
            new WeatherItem(new DateTime(2008, 6, 10, 21, 0, 0, 0), 64.40, 1021, 49),
            new WeatherItem(new DateTime(2008, 6, 10, 18, 0, 0, 0), 72.50, 1020, 45),
            new WeatherItem(new DateTime(2008, 6, 10, 15, 0, 0, 0), 72.68, 1021, 48),
            new WeatherItem(new DateTime(2008, 6, 10, 12, 0, 0, 0), 69.62, 1023, 57),
            new WeatherItem(new DateTime(2008, 6, 10, 9, 0, 0, 0),  67.28, 1023, 66),
            new WeatherItem(new DateTime(2008, 6, 10, 6, 0, 0, 0),  62.42, 1023, 78),
            new WeatherItem(new DateTime(2008, 6, 10, 3, 0, 0, 0),  60.62, 1021, 83),
            new WeatherItem(new DateTime(2008, 6, 10, 0, 0, 0, 0),  62.60, 1023, 72),
            new WeatherItem(new DateTime(2008, 6, 9, 21, 0, 0, 0),  71.96, 1023, 52),
            new WeatherItem(new DateTime(2008, 6, 9, 18, 0, 0, 0),  77.90, 1021, 40),
            new WeatherItem(new DateTime(2008, 6, 9, 15, 0, 0, 0),  78.98, 1023, 41),
            new WeatherItem(new DateTime(2008, 6, 9, 12, 0, 0, 0),  76.28, 1024, 37),
            new WeatherItem(new DateTime(2008, 6, 9, 9, 0, 0, 0),   71.06, 1024, 41),
            new WeatherItem(new DateTime(2008, 6, 9, 6, 0, 0, 0),   60.80, 1024, 68),
            new WeatherItem(new DateTime(2008, 6, 9, 3, 0, 0, 0),   58.64, 1023, 78),
            new WeatherItem(new DateTime(2008, 6, 9, 0, 0, 0, 0),   63.14, 1024, 71),
            new WeatherItem(new DateTime(2008, 6, 8, 21, 0, 0, 0),  68.54, 1023, 63),
            new WeatherItem(new DateTime(2008, 6, 8, 18, 0, 0, 0),  75.20, 1021, 47),
            new WeatherItem(new DateTime(2008, 6, 8, 15, 0, 0, 0),  77.18, 1021, 44),
            new WeatherItem(new DateTime(2008, 6, 8, 12, 0, 0, 0),  74.48, 1021, 48),
            new WeatherItem(new DateTime(2008, 6, 8, 9, 0, 0, 0),   64.58, 1021, 68),
            new WeatherItem(new DateTime(2008, 6, 8, 6, 0, 0, 0),   59.36, 1020, 81),
            new WeatherItem(new DateTime(2008, 6, 8, 3, 0, 0, 0),   60.08, 1019, 85),
            new WeatherItem(new DateTime(2008, 6, 8, 0, 0, 0, 0),   61.16, 1019, 76),
            new WeatherItem(new DateTime(2008, 6, 7, 21, 0, 0, 0),  63.86, 1019, 65),
            new WeatherItem(new DateTime(2008, 6, 7, 18, 0, 0, 0),  65.66, 1017, 57),
            new WeatherItem(new DateTime(2008, 6, 7, 15, 0, 0, 0),  65.12, 1017, 62),
            new WeatherItem(new DateTime(2008, 6, 7, 12, 0, 0, 0),  63.86, 1017, 53),
            new WeatherItem(new DateTime(2008, 6, 7, 9, 0, 0, 0),   61.52, 1017, 62),
            new WeatherItem(new DateTime(2008, 6, 7, 6, 0, 0, 0),   51.80, 1017, 76),
            new WeatherItem(new DateTime(2008, 6, 7, 3, 0, 0, 0),   52.34, 1016, 80),
            new WeatherItem(new DateTime(2008, 6, 7, 0, 0, 0, 0),   57.20, 1016, 82),
            new WeatherItem(new DateTime(2008, 6, 6, 21, 0, 0, 0),  60.44, 1016, 73),
            new WeatherItem(new DateTime(2008, 6, 6, 18, 0, 0, 0),  65.48, 1015, 57),
            new WeatherItem(new DateTime(2008, 6, 6, 15, 0, 0, 0),  66.56, 1015, 55),
            new WeatherItem(new DateTime(2008, 6, 6, 12, 0, 0, 0),  64.04, 1015, 64),
            new WeatherItem(new DateTime(2008, 6, 6, 9, 0, 0, 0),   60.26, 1015, 74),
            new WeatherItem(new DateTime(2008, 6, 6, 6, 0, 0, 0),   51.44, 1015, 89),
            new WeatherItem(new DateTime(2008, 6, 6, 3, 0, 0, 0),   50.18, 1015, 87),
            new WeatherItem(new DateTime(2008, 6, 6, 0, 0, 0, 0),   56.12, 1015, 80)
        };
    }
}
The following properties allow you to configure chart elements to series binding:
| Symbol | Description |
|---|---|
Series. |
Specifies a legend (or its View Model) that contains the series’ legend item. |
| XYSeries2D. |
Specifies the X-axis (or its View Model) that measures the series. |
| XYSeries2D. |
Specifies the Y-axis (or its View Model) that measures a series. |
| XYSeries2D. |
Specifies the pane (or its View Model) on which the series is plotted. |
| Chart |
Returns the collection of chart legends. |
| XYDiagram2D. |
Gets the X-axis. |
| XYDiagram2D. |
Gets the Y-axis. |
| XYDiagram2D. |
Provides access to a default pane object. |
| XYDiagram2D. |
Gets the collection of secondary X-axes. |
| XYDiagram2D. |
Gets the collection of secondary Y-axes. |
| XYDiagram2D. |
Provides access to the diagram‘s pane collection. |
See Also