IntervalDateTimeScaleOptions Class
Stores options for the date-time x-axis whose scale is divided into intervals.
Namespace: DevExpress.Xpf.Charts
Assembly: DevExpress.Xpf.Charts.v26.1.dll
NuGet Package: DevExpress.Wpf.Charts
Declaration
Remarks
Use the IntervalDateTimeScaleOptions class to specify the DateTimeScaleOptions property.
The IntervalDateTimeScaleOptions class introduces the following properties:
OverflowValue and UnderflowValue specify the overflow and underflow interval thresholds.
Pattern formats the interval-related text for axis and crosshair labels.
OverflowValuePattern and UnderflowValuePattern formats text for the overflow and underflow intervals.
Example
This example demonstrates how to create a histogram chart based on date-time values.
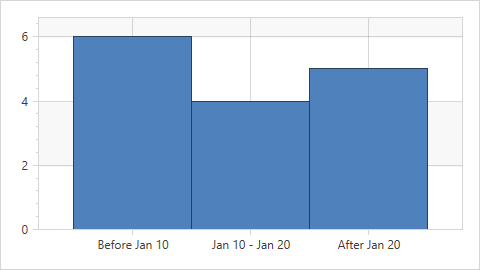
Use the following API members to configure histogram options:
| Member | Description |
|---|---|
IntervalDateTimeScaleOptions |
Stores options for the date-time x-axis whose scale is divided into intervals. |
| ManualDateTimeScaleOptions.AggregateFunction | Gets or sets the function that is used to aggregate date-time axis data when one of the AxisX2D.DateTimeScaleOptions, AxisX3D.DateTimeScaleOptions, or RadarAxisX2D.DateTimeScaleOptions properties is set to ManualDateTimeScaleOptions. |
| OverflowValue | Gets or sets the overflow interval’s start value. |
| UnderflowValue | Gets or sets the underflow interval’s end value. |
| Pattern | Gets or sets a format string that configures text for the axis label and crosshair label. |
| OverflowValuePattern | Gets or sets a format string that configures text for the overflow interval axis label and crosshair label. |
| UnderflowValuePattern | Gets or sets a format string that configures text for the underflow interval axis label and crosshair label. |
<dxc:ChartControl x:Name="chartControl"
                  Width="480" Height="270">
    <dxc:XYDiagram2D>
        <dxc:XYDiagram2D.AxisX>
            <dxc:AxisX2D TickmarksMinorVisible="False"
                         GridLinesVisible="True">
                <dxc:AxisX2D.DateTimeScaleOptions>
                    <!-- Configure histogram options. -->
                    <dxc:IntervalDateTimeScaleOptions AggregateFunction="Histogram"
                                                      OverflowValue="2019/01/20"
                                                      UnderflowValue="2019/01/10"
                                                      Pattern="{}{A1:MMM dd} - {A2:MMM dd}"
                                                      OverflowValuePattern="After {A1: MMM dd}"
                                                      UnderflowValuePattern="Before {A2: MMM dd}"/>
                    <!--...-->
                </dxc:AxisX2D.DateTimeScaleOptions>
                <dxc:AxisX2D.WholeRange>
                    <dxc:Range SideMarginsValue="0.8" AutoSideMargins="False"/>
                </dxc:AxisX2D.WholeRange>
            </dxc:AxisX2D>
        </dxc:XYDiagram2D.AxisX>
        <dxc:BarSideBySideSeries2D  DisplayName="Series"
                                    DataSource="{Binding}"
                                    ArgumentDataMember="Date"
                                    ArgumentScaleType="DateTime"
                                    BarWidth="1">
        </dxc:BarSideBySideSeries2D>
    </dxc:XYDiagram2D>
</dxc:ChartControl>