CountSummaryFunction Class
The summary function that calculates the number of points.
Namespace: DevExpress.Xpf.Charts
Assembly: DevExpress.Xpf.Charts.v26.1.dll
NuGet Package: DevExpress.Wpf.Charts
Declaration
Remarks
Assign a Summary object to the Series.Summary property to summarize data point values.
Then assign a CountSummaryFunction object to the Summary.Function property.
For numerical and date-time x-axis scales, the function aggregates data point values for each interval specified by the MeasureUnit (NumericSummaryOptions.MeasureUnit or DateTimeSummaryOptions.MeasureUnit) property.
In addition to the CountSummaryFunction, the Chart Control provides the following summary functions:
Example
The example demonstrates how to apply CountSummaryFunction to aggregate data points.
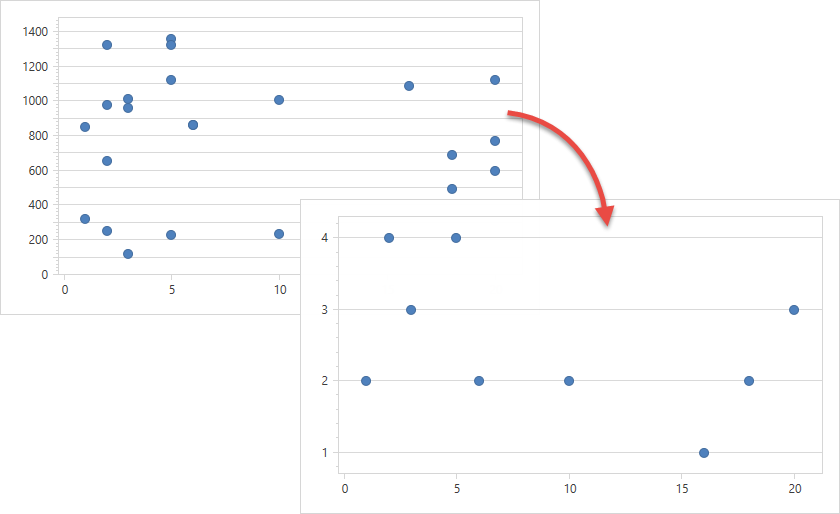
Use the following API members to configure the summary function options:
| Member | Description |
|---|---|
| Series.Summary | Gets or sets the series data point summarization settings. |
| Summary | Stores the series data point summarize options. |
| Summary.Function | Specifies the summary function that calculates data point values. |
CountSummaryFunction |
The summary function that calculates the number of points. |
<Window.DataContext>
    <local:ChartViewModel/>
</Window.DataContext>
<Grid>
    <dxc:ChartControl Width="540" Height="315">
        <dxc:XYDiagram2D>
            <dxc:PointSeries2D DataSource="{Binding Data}"
                               ArgumentDataMember="Argument"
                               ValueDataMember="Value">
                <!-- Configure the summary function options. -->
                <dxc:PointSeries2D.Summary>
                    <dxc:Summary>
                        <dxc:Summary.Function>
                            <dxc:CountSummaryFunction/>
                        </dxc:Summary.Function>
                    </dxc:Summary>
                </dxc:PointSeries2D.Summary>
                <!--...-->
            </dxc:PointSeries2D>
            <dxc:XYDiagram2D.AxisY>
                <dxc:AxisY2D Interlaced="False">
                    <dxc:AxisY2D.NumericScaleOptions>
                        <dxc:ContinuousNumericScaleOptions GridSpacing="1" AutoGrid="False"/>
                    </dxc:AxisY2D.NumericScaleOptions>
                    <dxc:AxisY2D.WholeRange>
                        <dxc:Range dxc:AxisY2D.AlwaysShowZeroLevel="False"/>
                    </dxc:AxisY2D.WholeRange>
                </dxc:AxisY2D>
            </dxc:XYDiagram2D.AxisY>
        </dxc:XYDiagram2D>
    </dxc:ChartControl>
</Grid>