PolarLineScatterSeries2D Class
A 2D scatter polar line series.
Namespace: DevExpress.Xpf.Charts
Assembly: DevExpress.Xpf.Charts.v26.1.dll
Declaration
Remarks
The resulting diagram obtained using the example code should look like the following.
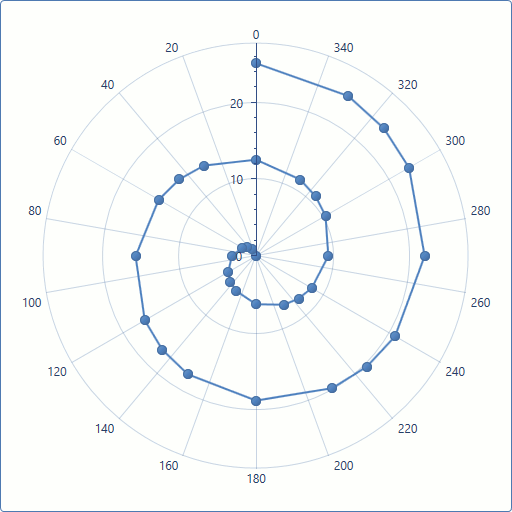
Example
The following example demonstrates how to create a 2D Scatter Polar Line chart.
To do this, it is necessary to assign the ChartControl.Diagram property to PolarDiagram2D, and then add a PolarLineScatterSeries2D object with points to the radar diagram Diagram.Series collection.
<dxc:ChartControl>
    <dxc:PolarDiagram2D>
        <dxc:PolarLineScatterSeries2D>
            <dxc:SeriesPoint Argument="0" Value="0"/>
            <dxc:SeriesPoint Argument="30" Value="1.047197551"/>
            <dxc:SeriesPoint Argument="45" Value="1.570796327"/>
            <dxc:SeriesPoint Argument="60" Value="2.094395102"/>
            <dxc:SeriesPoint Argument="90" Value="3.141592654"/>
            <dxc:SeriesPoint Argument="120" Value="4.188790205"/>
            <dxc:SeriesPoint Argument="135" Value="4.71238898"/>
            <dxc:SeriesPoint Argument="150" Value="5.235987756"/>
            <dxc:SeriesPoint Argument="180" Value="6.283185307"/>
            <dxc:SeriesPoint Argument="210" Value="7.330382858"/>
            <dxc:SeriesPoint Argument="225" Value="7.853981634"/>
            <dxc:SeriesPoint Argument="240" Value="8.37758041"/>
            <dxc:SeriesPoint Argument="270" Value="9.424777961"/>
            <dxc:SeriesPoint Argument="300" Value="10.47197551"/>
            <dxc:SeriesPoint Argument="315" Value="10.99557429"/>
            <dxc:SeriesPoint Argument="330" Value="11.51917306"/>
            <dxc:SeriesPoint Argument="0" Value="12.56637061"/>
            <dxc:SeriesPoint Argument="30" Value="13.61356817"/>
            <dxc:SeriesPoint Argument="45" Value="14.13716694"/>
            <dxc:SeriesPoint Argument="60" Value="14.66076572"/>
            <dxc:SeriesPoint Argument="90" Value="15.70796327"/>
            <dxc:SeriesPoint Argument="120" Value="16.75516082"/>
            <dxc:SeriesPoint Argument="135" Value="17.27875959"/>
            <dxc:SeriesPoint Argument="150" Value="17.80235837"/>
            <dxc:SeriesPoint Argument="180" Value="18.84955592"/>
            <dxc:SeriesPoint Argument="210" Value="19.89675347"/>
            <dxc:SeriesPoint Argument="225" Value="20.42035225"/>
            <dxc:SeriesPoint Argument="240" Value="20.94395102"/>
            <dxc:SeriesPoint Argument="270" Value="21.99114858"/>
            <dxc:SeriesPoint Argument="300" Value="23.03834613"/>
            <dxc:SeriesPoint Argument="315" Value="23.5619449"/>
            <dxc:SeriesPoint Argument="330" Value="24.08554368"/>
            <dxc:SeriesPoint Argument="360" Value="25.13274123"/>
        </dxc:PolarLineScatterSeries2D>
    </dxc:PolarDiagram2D>
</dxc:ChartControl>
Inheritance
See Also