Series.Summary Property
Gets or sets the series data point summarization settings.
Namespace: DevExpress.Xpf.Charts
Assembly: DevExpress.Xpf.Charts.v26.1.dll
NuGet Package: DevExpress.Wpf.Charts
Declaration
Property Value
| Type | Description |
|---|---|
| Summary | The series data summarization options. |
Remarks
Use the Summary.Function property to specify a function that the Chart Control uses to summarize series data point values.
The following built-in summary functions are available:
- AverageSummaryFunction
- CountSummaryFunction
- MaxSummaryFunction
- MinSummaryFunction
- SumSummaryFunction
Example
The example demonstrates how to apply AverageSummaryFunction to aggregate data points.
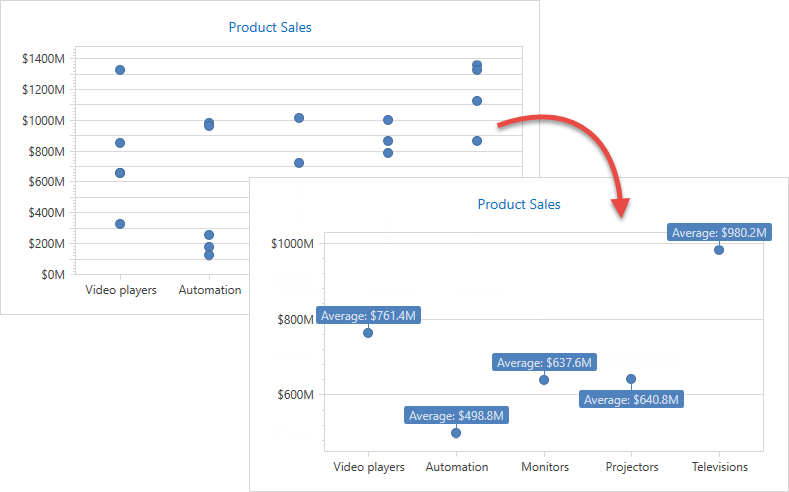
Use the following API members to configure the summary function options:
| Member | Description |
|---|---|
Series.Summary |
Gets or sets the series data point summarization settings. |
| Summary | Stores the series data point summarize options. |
| Summary.Function | Specifies the summary function that calculates data point values. |
| AverageSummaryFunction | The summary function that calculates the average of data point values. |
| DataMemberSummaryFunction.ValueDataMember | Gets or sets the data source field that provides data to be aggregated. |
<Window.DataContext>
    <local:ChartViewModel/>
</Window.DataContext>
<Grid>
    <dxc:ChartControl>
        <dxc:XYDiagram2D SeriesItemsSource="{Binding SaleSeries}">
            <dxc:XYDiagram2D.SeriesItemTemplate>
                <DataTemplate>
                    <dxc:PointSeries2D DataSource="{Binding Values}"
                                       ArgumentDataMember="Category"
                                       ValueDataMember="Value">
                        <!-- Configure the summary function options. -->
                        <dxc:PointSeries2D.Summary>
                            <dxc:Summary>
                                <dxc:Summary.Function>
                                    <dxc:AverageSummaryFunction ValueDataMember="Value"/>
                                </dxc:Summary.Function>
                            </dxc:Summary>
                        </dxc:PointSeries2D.Summary>
                        <!--...-->
                        <dxc:PointSeries2D.Label>
                            <dxc:SeriesLabel Visible="True" TextPattern="Average: ${V}M"
                                             dxc:MarkerSeries2D.Angle="90" ResolveOverlappingMode="JustifyAroundPoint"/>
                        </dxc:PointSeries2D.Label>
                    </dxc:PointSeries2D>
                </DataTemplate>
            </dxc:XYDiagram2D.SeriesItemTemplate>
            <dxc:XYDiagram2D.AxisX>
                <dxc:AxisX2D TickmarksMinorVisible="False"/>
            </dxc:XYDiagram2D.AxisX>
            <dxc:XYDiagram2D.AxisY>
                <dxc:AxisY2D Interlaced="False">
                    <dxc:AxisY2D.WholeRange>
                        <dxc:Range dxc:AxisY2D.AlwaysShowZeroLevel="False"/>
                    </dxc:AxisY2D.WholeRange>
                    <dxc:AxisY2D.Label>
                        <dxc:AxisLabel TextPattern="${V}M"/>
                    </dxc:AxisY2D.Label>
                </dxc:AxisY2D>
            </dxc:XYDiagram2D.AxisY>
        </dxc:XYDiagram2D>
        <dxc:ChartControl.Titles>
            <dxc:Title Content="Product Sales" HorizontalAlignment="Center" FontSize="14"/>
        </dxc:ChartControl.Titles>
    </dxc:ChartControl>
</Grid>
See Also