TitleCollection Class
Represents the collection of explanatory titles for a chart or series.
Namespace: DevExpress.Xpf.Charts
Assembly: DevExpress.Xpf.Charts.v26.1.dll
Declaration
Related API Members
The following members return TitleCollection objects:
Remarks
An object of the TitleCollection type is returned by the ChartControlBase.Titles and PieSeries.Titles properties. An individual title is represented by the Title class instance.
Example
This example demonstrates how to display a chart title as a group of checkboxes that control series visibility.
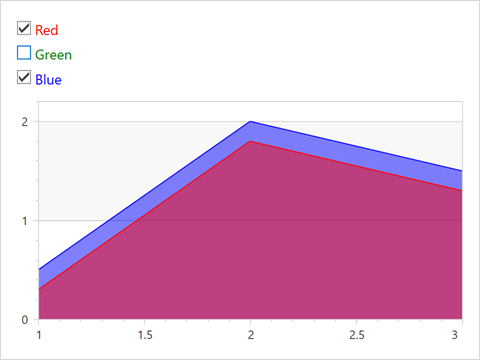
- Define a WrapPanel with a set of CheckBox elements.
- Bind their check state to the Series.Visible property of the corresponding series.
- Add this WrapPanel as a chart title to the ChartControlBase.Titles collection.
Note
You can also use legend checkboxes to manage series visibility.
<Window x:Class="CustomChartTitles.MainWindow"
        xmlns="http://schemas.microsoft.com/winfx/2006/xaml/presentation"
        xmlns:x="http://schemas.microsoft.com/winfx/2006/xaml"
        xmlns:dxc="http://schemas.devexpress.com/winfx/2008/xaml/charts"
        Title="Custom Chart Titles" Height="380" Width="650">
    <Grid>
        <dxc:ChartControl Name="chart">
            <dxc:ChartControl.Titles>
                <dxc:Title>
                    <WrapPanel Orientation="Vertical">
                        <CheckBox Name="chRed" Foreground="Red" IsChecked="True" FontSize="14">
                            Red
                        </CheckBox>
                        <CheckBox Name="chGreen" Foreground="Green" IsChecked="True" FontSize="14">
                            Green
                        </CheckBox>
                        <CheckBox Name="chBlue" Foreground="Blue" IsChecked="True" FontSize="14">
                            Blue
                        </CheckBox>
                    </WrapPanel>
                </dxc:Title>
            </dxc:ChartControl.Titles>
            <dxc:ChartControl.Diagram>
                <dxc:XYDiagram2D>
                    <dxc:XYDiagram2D.AxisX>
                        <dxc:AxisX2D>
                            <dxc:AxisX2D.Range>
                                <dxc:AxisRange SideMarginsEnabled="False" />
                            </dxc:AxisX2D.Range>
                        </dxc:AxisX2D>
                    </dxc:XYDiagram2D.AxisX>
                    <dxc:XYDiagram2D.Series>
                        <dxc:AreaSeries2D Name="Blue" Brush="Blue" Transparency="0.5"
                                          Visible="{Binding ElementName=chBlue, Path=IsChecked}">
                            <dxc:AreaSeries2D.Points>
                                <dxc:SeriesPoint Argument="1" Value="0.5" />
                                <dxc:SeriesPoint Argument="2" Value="2" />
                                <dxc:SeriesPoint Argument="3" Value="1.5" />
                            </dxc:AreaSeries2D.Points>
                            <dxc:AreaSeries2D.Label>
                                <dxc:SeriesLabel Visible="False" />
                            </dxc:AreaSeries2D.Label>
                        </dxc:AreaSeries2D>
                        <dxc:AreaSeries2D Name="Red" Brush="Red" Transparency="0.5"
                                          Visible="{Binding ElementName=chRed, Path=IsChecked}">
                            <dxc:AreaSeries2D.Points>
                                <dxc:SeriesPoint Argument="1" Value="0.3" />
                                <dxc:SeriesPoint Argument="2" Value="1.8" />
                                <dxc:SeriesPoint Argument="3" Value="1.3" />
                            </dxc:AreaSeries2D.Points>
                            <dxc:AreaSeries2D.Label>
                                <dxc:SeriesLabel Visible="False" />
                            </dxc:AreaSeries2D.Label>
                        </dxc:AreaSeries2D>
                        <dxc:AreaSeries2D Name="Green" Brush="Green" Transparency="0.5"
                                          Visible="{Binding ElementName=chGreen, Path=IsChecked}">
                            <dxc:AreaSeries2D.Points>
                                <dxc:SeriesPoint Argument="1" Value="0.1" />
                                <dxc:SeriesPoint Argument="2" Value="1.6" />
                                <dxc:SeriesPoint Argument="3" Value="1.1" />
                            </dxc:AreaSeries2D.Points>
                            <dxc:AreaSeries2D.Label>
                                <dxc:SeriesLabel Visible="False" />
                            </dxc:AreaSeries2D.Label>
                        </dxc:AreaSeries2D>
                    </dxc:XYDiagram2D.Series>
                </dxc:XYDiagram2D>
            </dxc:ChartControl.Diagram>
        </dxc:ChartControl>
    </Grid>
</Window>
Inheritance
See Also