ManualDateTimeScaleOptions Class
Contains settings for a date-time axis data when its scale mode is manual.
Namespace: DevExpress.Xpf.Charts
Assembly: DevExpress.Xpf.Charts.v26.1.dll
Declaration
Remarks
An object of the ManualDateTimeScaleOptions type is returned by the AxisX2D.DateTimeScaleOptions, AxisX3D.DateTimeScaleOptions, and RadarAxisX2D.DateTimeScaleOptions properties.
In this mode, the ManualDateTimeScaleOptions.GridAlignment and ManualDateTimeScaleOptions.MeasureUnit properties are available. These properties allow you to define the output format of date-time values shown by the axis labels.
For instance, you can use the ManualDateTimeScaleOptions.MeasureUnit property to determine the detail level for date-time values (e.g., Millisecond, Second, Minute, Hour, Day, etc.).
Data for each interval on the X-axis is aggregated using the function specified by the ManualDateTimeScaleOptions.AggregateFunction property. Although by default, the aggregate function is set to Average, it can be changed to Minimum, Maximum, Sum, etc.
To learn more, see Data Aggregation.
Example
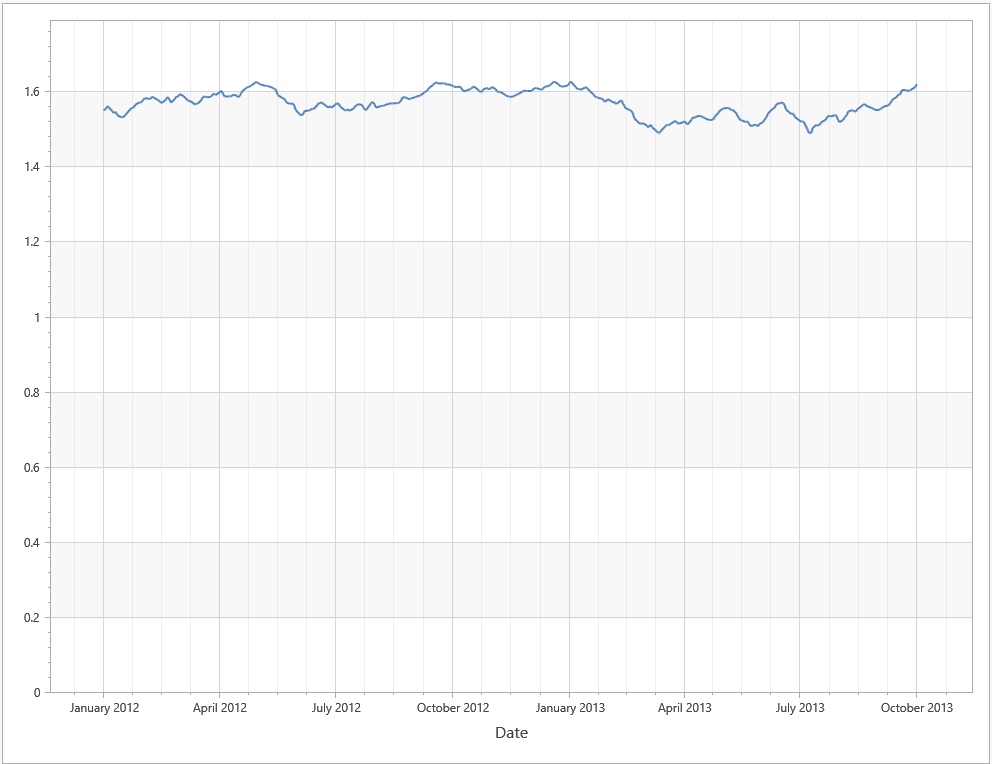
This example uses manual date-time scale options of the X-axis. It sets the AxisX2D.DateTimeScaleOptions property to ManualDateTimeScaleOptions and specifies GridAlignment, MeasureUnit, and AggregateFunction properties.
This example obtains data from the GbpUsdRate.xml file. Download GbpUsdRate.xml
<dx:ThemedWindow
    xmlns="http://schemas.microsoft.com/winfx/2006/xaml/presentation"
    xmlns:x="http://schemas.microsoft.com/winfx/2006/xaml"
    xmlns:dx="http://schemas.devexpress.com/winfx/2008/xaml/core"
    xmlns:dxc="http://schemas.devexpress.com/winfx/2008/xaml/charts"
    x:Class="DXWPFCharts.MainWindow"
    Title="MainWindow" Height="800" Width="1000">
    <Grid>
        <dxc:ChartControl>
            <dxc:XYDiagram2D >
                <dxc:XYDiagram2D.AxisX>
                    <dxc:AxisX2D GridLinesMinorVisible="True" GridLinesVisible="True" MinorCount="3">
                        <dxc:AxisX2D.Title>
                            <dxc:AxisTitle Content="Date"/>
                        </dxc:AxisX2D.Title>
                        <dxc:AxisX2D.DateTimeScaleOptions>
                            <dxc:ManualDateTimeScaleOptions AggregateFunction="Maximum" AutoGrid="False"
                                                            GridAlignment="Month" MeasureUnit="Day"
                                                            GridSpacing="3" GridOffset="1"/>
                        </dxc:AxisX2D.DateTimeScaleOptions>
                    </dxc:AxisX2D>
                </dxc:XYDiagram2D.AxisX>
                <dxc:LineSeries2D DataSource="{Binding Path=Rate}"
                                  ArgumentDataMember="Argument" ValueDataMember="Value" />
            </dxc:XYDiagram2D>
        </dxc:ChartControl>
    </Grid>
</dx:ThemedWindow>
Tip
To use automatic date-time scale options, set the AxisX2D.DateTimeScaleOptions property to AutomaticDateTimeScaleOptions and select the appropriate AutomaticDateTimeScaleOptions.AggregateFunction.