ChartToolTipController Class
Provides options that define the tooltip appearance and behavior for a chart.
Namespace: DevExpress.Xpf.Charts
Assembly: DevExpress.Xpf.Charts.v26.1.dll
Declaration
Related API Members
The following members return ChartToolTipController objects:
Remarks
Use the ChartControl.ToolTipController property to get access to the ChartToolTipController object.
Then, it becomes possible to customize the tooltip appearance on a chart (e.g., ChartToolTipController.ShowBeak, ChartToolTipController.ShowShadow) and define the tooltip behavior (e.g, ChartToolTipController.CloseOnClick, ChartToolTipController.OpenMode and ChartToolTipController.InitialDelay).
For more information on how to use a tooltip in your application, see the Tooltips topic.
Example
This example demonstrates how to show a tooltip when a user clicks a series point.
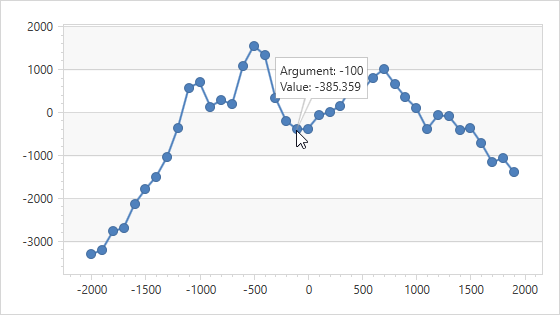
Set the ChartControl.ToolTipEnabled property to true to enable tooltips. Until you disable ChartControlBase.CrosshairEnabled, the Crosshair Cursor and tooltip are shown simultaneously.
To invoke a tooltip for a marker series, such as LineSeries2D, user should click or hover over a point marker. Set the LineSeries2D.MarkerVisible property to true to enable markers.
The Series.ToolTipPointPattern property defines the text shown in a tooltip for a point.
To customize the tooltip behavior, initialize the ChartControl.ToolTipController property with an ChartToolTipController object. Specify its ChartToolTipController.OpenMode, ChartToolTipController.ShowShadow, ChartToolTipController.InitialDelay, and ChartToolTipController.ContentMargin properties.
<dxc:ChartControl CrosshairEnabled="False"
ToolTipEnabled="True">
<dxc:ChartControl.ToolTipController>
<dxc:ChartToolTipController OpenMode="OnClick"
ShowShadow="False"
InitialDelay="0:0:0.4"
ContentMargin="4"/>
</dxc:ChartControl.ToolTipController>
<dxc:XYDiagram2D>
<dxc:LineSeries2D MarkerVisible="True"
ToolTipPointPattern="{}Argument: {A}
Value: {V:f3}"/>
</dxc:XYDiagram2D>
</dxc:ChartControl>