DataMemberSummaryFunction.ValueDataMember Property
Gets or sets the data source field that provides data to be aggregated.
Namespace: DevExpress.Xpf.Charts
Assembly: DevExpress.Xpf.Charts.v26.1.dll
Declaration
Property Value
| Type | Description |
|---|---|
| String | The string that is the data field name. |
Remarks
The Series.ValueDataMember property value is ignored if the DataMemberSummaryFunction.ValueDataMember is specified.
Example
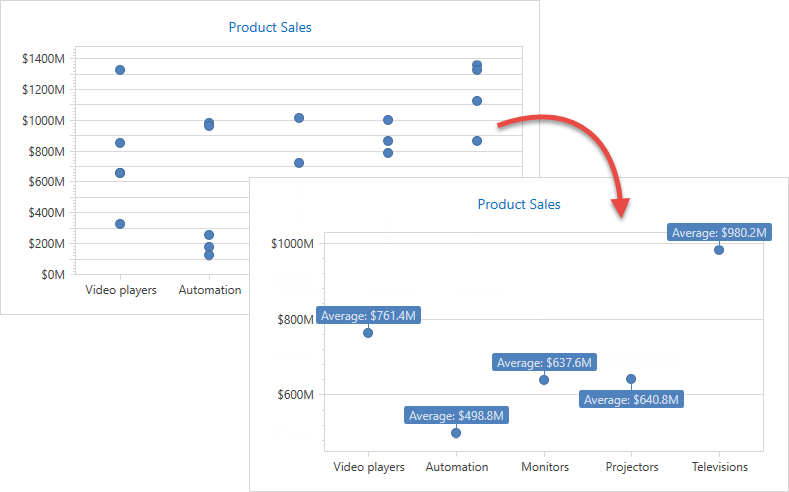
The example demonstrates how to apply AverageSummaryFunction to aggregate data points.
Use the following API members to configure the summary function options:
| Member | Description |
|---|---|
| Series.Summary | Gets or sets the series data point summarization settings. |
| Summary | Stores the series data point summarize options. |
| Summary.Function | Specifies the summary function that calculates data point values. |
| AverageSummaryFunction | The summary function that calculates the average of data point values. |
DataMemberSummaryFunction.ValueDataMember |
Gets or sets the data source field that provides data to be aggregated. |
<Window.DataContext>
    <local:ChartViewModel/>
</Window.DataContext>
<Grid>
    <dxc:ChartControl>
        <dxc:XYDiagram2D SeriesItemsSource="{Binding SaleSeries}">
            <dxc:XYDiagram2D.SeriesItemTemplate>
                <DataTemplate>
                    <dxc:PointSeries2D DataSource="{Binding Values}"
                                       ArgumentDataMember="Category"
                                       ValueDataMember="Value">
                        <!-- Configure the summary function options. -->
                        <dxc:PointSeries2D.Summary>
                            <dxc:Summary>
                                <dxc:Summary.Function>
                                    <dxc:AverageSummaryFunction ValueDataMember="Value"/>
                                </dxc:Summary.Function>
                            </dxc:Summary>
                        </dxc:PointSeries2D.Summary>
                        <!--...-->
                        <dxc:PointSeries2D.Label>
                            <dxc:SeriesLabel Visible="True" TextPattern="Average: ${V}M"
                                             dxc:MarkerSeries2D.Angle="90" ResolveOverlappingMode="JustifyAroundPoint"/>
                        </dxc:PointSeries2D.Label>
                    </dxc:PointSeries2D>
                </DataTemplate>
            </dxc:XYDiagram2D.SeriesItemTemplate>
            <dxc:XYDiagram2D.AxisX>
                <dxc:AxisX2D TickmarksMinorVisible="False"/>
            </dxc:XYDiagram2D.AxisX>
            <dxc:XYDiagram2D.AxisY>
                <dxc:AxisY2D Interlaced="False">
                    <dxc:AxisY2D.WholeRange>
                        <dxc:Range dxc:AxisY2D.AlwaysShowZeroLevel="False"/>
                    </dxc:AxisY2D.WholeRange>
                    <dxc:AxisY2D.Label>
                        <dxc:AxisLabel TextPattern="${V}M"/>
                    </dxc:AxisY2D.Label>
                </dxc:AxisY2D>
            </dxc:XYDiagram2D.AxisY>
        </dxc:XYDiagram2D>
        <dxc:ChartControl.Titles>
            <dxc:Title Content="Product Sales" HorizontalAlignment="Center" FontSize="14"/>
        </dxc:ChartControl.Titles>
    </dxc:ChartControl>
</Grid>
See Also