ManualDateTimeScaleOptions.GridOffset Property
Gets or sets the offset of grid lines.
Namespace: DevExpress.Xpf.Charts
Assembly: DevExpress.Xpf.Charts.v26.1.dll
Declaration
Property Value
| Type | Description |
|---|---|
| Double | A Double value which specifies the grid offset. |
Remarks
By default, the ManualDateTimeScaleOptions.AutoGrid is true, and the GridOffset is set automatically. If you wish to change the grid offset, specify the GridOffset property value.
Example
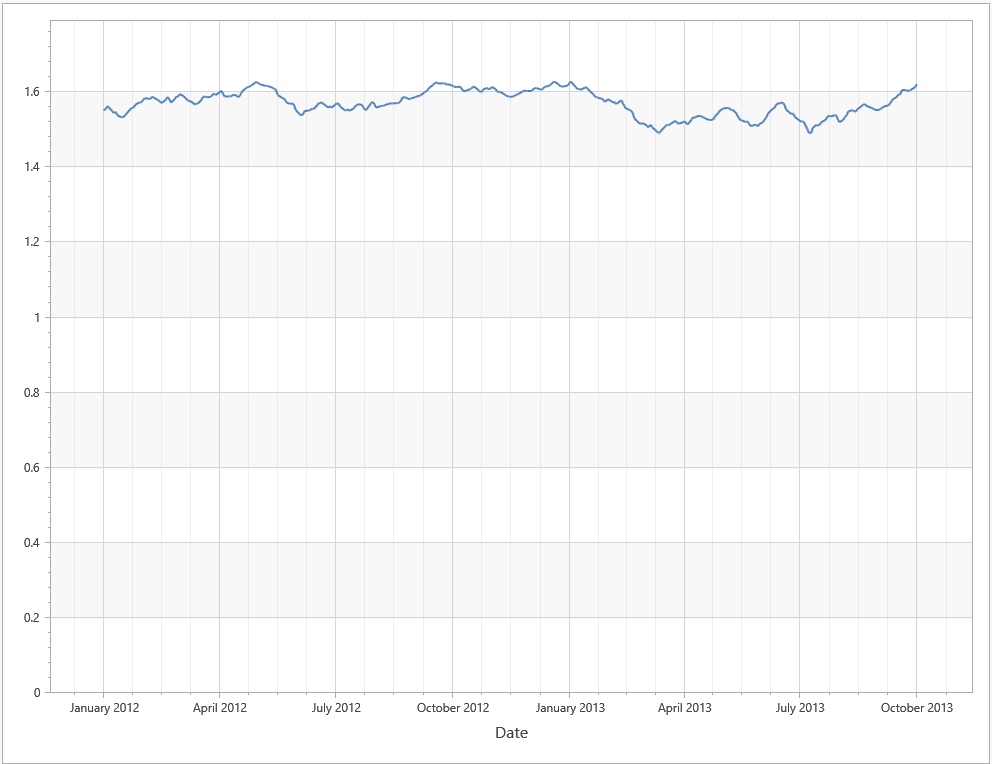
This example uses manual date-time scale options of the X-axis. It sets the AxisX2D.DateTimeScaleOptions property to ManualDateTimeScaleOptions and specifies GridAlignment, MeasureUnit, and AggregateFunction properties.
This example obtains data from the GbpUsdRate.xml file. Download GbpUsdRate.xml
<dx:ThemedWindow
    xmlns="http://schemas.microsoft.com/winfx/2006/xaml/presentation"
    xmlns:x="http://schemas.microsoft.com/winfx/2006/xaml"
    xmlns:dx="http://schemas.devexpress.com/winfx/2008/xaml/core"
    xmlns:dxc="http://schemas.devexpress.com/winfx/2008/xaml/charts"
    x:Class="DXWPFCharts.MainWindow"
    Title="MainWindow" Height="800" Width="1000">
    <Grid>
        <dxc:ChartControl>
            <dxc:XYDiagram2D >
                <dxc:XYDiagram2D.AxisX>
                    <dxc:AxisX2D GridLinesMinorVisible="True" GridLinesVisible="True" MinorCount="3">
                        <dxc:AxisX2D.Title>
                            <dxc:AxisTitle Content="Date"/>
                        </dxc:AxisX2D.Title>
                        <dxc:AxisX2D.DateTimeScaleOptions>
                            <dxc:ManualDateTimeScaleOptions AggregateFunction="Maximum" AutoGrid="False"
                                                            GridAlignment="Month" MeasureUnit="Day"
                                                            GridSpacing="3" GridOffset="1"/>
                        </dxc:AxisX2D.DateTimeScaleOptions>
                    </dxc:AxisX2D>
                </dxc:XYDiagram2D.AxisX>
                <dxc:LineSeries2D DataSource="{Binding Path=Rate}"
                                  ArgumentDataMember="Argument" ValueDataMember="Value" />
            </dxc:XYDiagram2D>
        </dxc:ChartControl>
    </Grid>
</dx:ThemedWindow>
Tip
To use automatic date-time scale options, set the AxisX2D.DateTimeScaleOptions property to AutomaticDateTimeScaleOptions and select the appropriate AutomaticDateTimeScaleOptions.AggregateFunction.