ManualDateTimeScaleOptions.GridAlignment Property
Gets or sets the date-time measure unit to which the beginning of the grid lines and axis labels of an axis should be aligned.
Namespace: DevExpress.Xpf.Charts
Assembly: DevExpress.Xpf.Charts.v26.1.dll
Declaration
Property Value
| Type | Description |
|---|---|
| DateTimeGridAlignment | A DateTimeGridAlignment enumeration value that represents the measurement unit to which the beginning of the gridlines and labels of an axis should be aligned. |
Available values:
| Name | Description |
|---|---|
| Millisecond | Specifies millisecond as the date-time unit to which axis grid lines should be aligned. |
| Second | Specifies second as the date-time unit to which axis grid lines should be aligned. |
| Minute | Specifies minute as the date-time unit to which axis grid lines should be aligned. |
| Hour | Specifies hour as the date-time unit to which axis grid lines should be aligned. |
| Day | Specifies day as the date-time unit to which axis grid lines should be aligned. |
| Week | Specifies week as the date-time unit to which axis grid lines should be aligned. |
| Month | Specifies month as the date-time unit to which axis grid lines should be aligned. |
| Quarter | Specifies a quarter of a year as the date-time unit to which axis grid lines should be aligned. |
| Year | Specifies year as the date-time unit to which axis grid lines should be aligned. |
Remarks
This property is available when one of the DateTimeScaleOptions properties (e.g., AxisX2D.DateTimeScaleOptions property) is set to ManualDateTimeScaleOptions.
| GridAlignment = Month, MeasureUnit=Day | GridAlignment = Year, MeasureUnit=Day |
|---|---|
 |
 |
To maintain date-time values at different detail levels, use the ManualDateTimeScaleOptions.MeasureUnit property.
Example
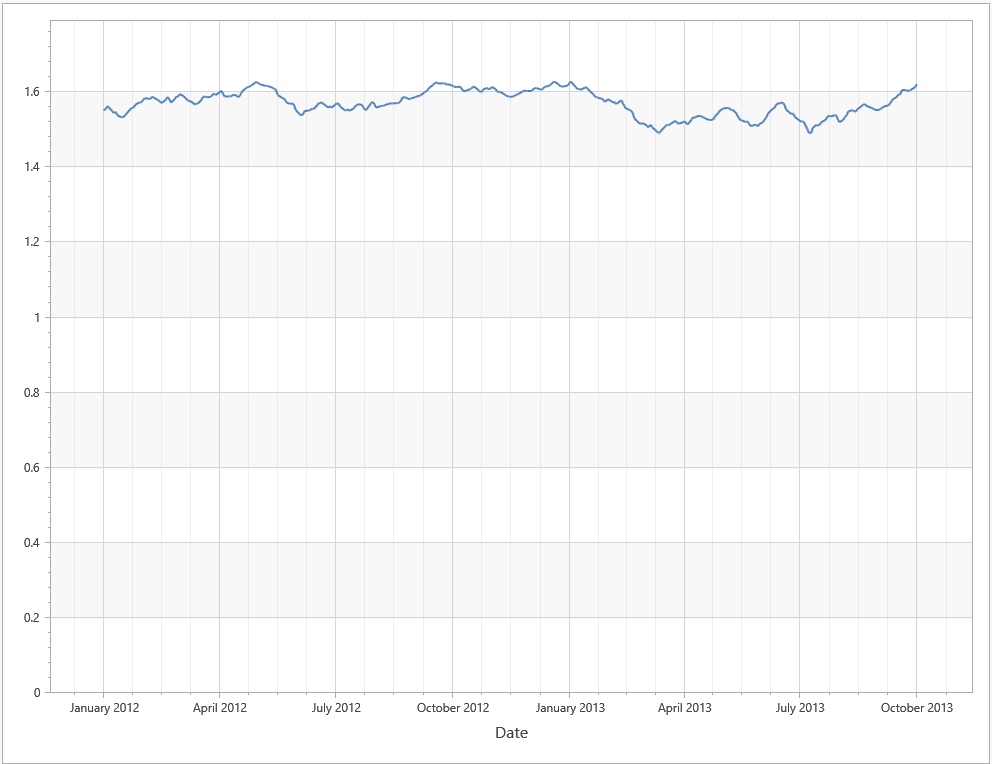
This example uses manual date-time scale options of the X-axis. It sets the AxisX2D.DateTimeScaleOptions property to ManualDateTimeScaleOptions and specifies GridAlignment, MeasureUnit, and AggregateFunction properties.
This example obtains data from the GbpUsdRate.xml file. Download GbpUsdRate.xml
<dx:ThemedWindow
    xmlns="http://schemas.microsoft.com/winfx/2006/xaml/presentation"
    xmlns:x="http://schemas.microsoft.com/winfx/2006/xaml"
    xmlns:dx="http://schemas.devexpress.com/winfx/2008/xaml/core"
    xmlns:dxc="http://schemas.devexpress.com/winfx/2008/xaml/charts"
    x:Class="DXWPFCharts.MainWindow"
    Title="MainWindow" Height="800" Width="1000">
    <Grid>
        <dxc:ChartControl>
            <dxc:XYDiagram2D >
                <dxc:XYDiagram2D.AxisX>
                    <dxc:AxisX2D GridLinesMinorVisible="True" GridLinesVisible="True" MinorCount="3">
                        <dxc:AxisX2D.Title>
                            <dxc:AxisTitle Content="Date"/>
                        </dxc:AxisX2D.Title>
                        <dxc:AxisX2D.DateTimeScaleOptions>
                            <dxc:ManualDateTimeScaleOptions AggregateFunction="Maximum" AutoGrid="False"
                                                            GridAlignment="Month" MeasureUnit="Day"
                                                            GridSpacing="3" GridOffset="1"/>
                        </dxc:AxisX2D.DateTimeScaleOptions>
                    </dxc:AxisX2D>
                </dxc:XYDiagram2D.AxisX>
                <dxc:LineSeries2D DataSource="{Binding Path=Rate}"
                                  ArgumentDataMember="Argument" ValueDataMember="Value" />
            </dxc:XYDiagram2D>
        </dxc:ChartControl>
    </Grid>
</dx:ThemedWindow>
Tip
To use automatic date-time scale options, set the AxisX2D.DateTimeScaleOptions property to AutomaticDateTimeScaleOptions and select the appropriate AutomaticDateTimeScaleOptions.AggregateFunction.