XYSeries.ColorEach Property
Indicates whether each point marker of a series is shown with a different color.
Namespace: DevExpress.Xpf.Charts
Assembly: DevExpress.Xpf.Charts.v23.2.dll
NuGet Package: DevExpress.Wpf.Charts
Declaration
Property Value
| Type | Description |
|---|---|
| Boolean | true to paint each point marker with a different color; otherwise, false. |
Remarks
Use the ColorEach property to control whether data point markers are drawn in different colors.
If the ColorEach property is enabled, colors for point markers are taken from the palette specified via the ChartControlBase.Palette property.
Example
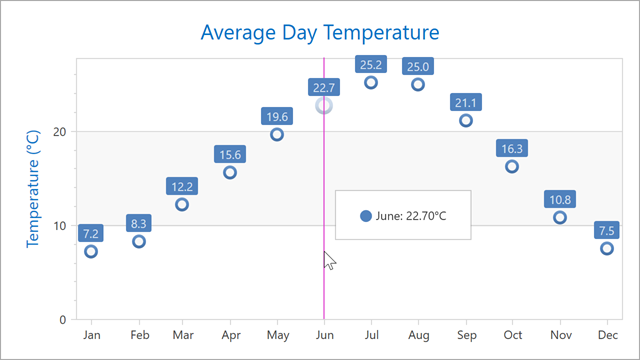
This example shows how to create a 2D Point chart and configure its titles, label format, axes, and appearance.
Follow the steps below to create a 2D Point chart:
Create a ChartControl and set its
DataContextproperty to a ViewModel.Set the chart’s Diagram property to an XYDiagram2D object.
Add a PointSeries2D to the diagram’s Series collection.
Specify the following series parameters to bind the series to data:
For more information about series, refer to the following topic: Series.
Set the Series.LabelsVisibility property to
Trueto display point labels. Specify the SeriesLabel.TextPattern property to format labels.Use the XYDiagram2D.AxisX and XYDiagram2D.AxisY properties to customize axes (scale options, title, and labels). Refer to the following help topic for more information about axes: Axes.
Add a Title object to the ChartControl.Titles collection, and specify title content. Refer to the following topic for more information about titles: Chart Titles.
<Window x:Class="Point2DChart.Window1"
xmlns="http://schemas.microsoft.com/winfx/2006/xaml/presentation"
xmlns:x="http://schemas.microsoft.com/winfx/2006/xaml"
xmlns:dxc="http://schemas.devexpress.com/winfx/2008/xaml/charts"
xmlns:local ="clr-namespace:Point2DChart"
Title="Window1" Height="350" Width="620">
<Grid>
<dxc:ChartControl Name="chartControl1">
<dxc:ChartControl.DataContext>
<local:ChartViewModel/>
</dxc:ChartControl.DataContext>
<dxc:ChartControl.Diagram>
<dxc:XYDiagram2D>
<dxc:XYDiagram2D.Series>
<dxc:PointSeries2D DisplayName="Day Temperature"
DataSource="{Binding DataPoints}"
ArgumentScaleType="DateTime"
ArgumentDataMember="Time"
ValueDataMember="Value"
LabelsVisibility="True"
CrosshairLabelPattern="{}{A:MMMM}: {V:f2}°C"
MarkerSize="14">
<dxc:PointSeries2D.MarkerModel>
<dxc:RingMarker2DModel/>
</dxc:PointSeries2D.MarkerModel>
<dxc:PointSeries2D.Label>
<dxc:SeriesLabel TextPattern="{}{V:f1}"
dxc:MarkerSeries2D.Angle="90"
ConnectorVisible="False"/>
</dxc:PointSeries2D.Label>
</dxc:PointSeries2D>
</dxc:XYDiagram2D.Series>
<dxc:XYDiagram2D.AxisX>
<dxc:AxisX2D TickmarksMinorVisible="False">
<dxc:AxisX2D.WholeRange>
<dxc:Range SideMarginsValue="10"/>
</dxc:AxisX2D.WholeRange>
<dxc:AxisX2D.Label>
<dxc:AxisLabel TextPattern="{}{A:MMM}"/>
</dxc:AxisX2D.Label>
<dxc:AxisX2D.DateTimeScaleOptions>
<dxc:ManualDateTimeScaleOptions GridSpacing="1"
GridAlignment="Month"
AutoGrid="False"/>
</dxc:AxisX2D.DateTimeScaleOptions>
</dxc:AxisX2D>
</dxc:XYDiagram2D.AxisX>
<dxc:XYDiagram2D.AxisY>
<dxc:AxisY2D>
<dxc:AxisY2D.Title>
<dxc:AxisTitle Content="Temperature (°C)"/>
</dxc:AxisY2D.Title>
</dxc:AxisY2D>
</dxc:XYDiagram2D.AxisY>
</dxc:XYDiagram2D>
</dxc:ChartControl.Diagram>
<dxc:ChartControl.Titles>
<dxc:Title Dock="Top"
HorizontalAlignment="Center"
Content="Average Day Temperature"/>
</dxc:ChartControl.Titles>
</dxc:ChartControl>
</Grid>
</Window>
using System;
using System.Collections.Generic;
using System.Windows;
namespace Point2DChart {
    public class ChartViewModel {
        List<DataPoint> dataPoints;
        public List<DataPoint> DataPoints {
            get {
                if (dataPoints == null) {
                    dataPoints = new List<DataPoint> {
                            new DataPoint (new DateTime(2019, 1, 1), 7.2),
                            new DataPoint (new DateTime(2019, 2, 1), 8.3),
                            new DataPoint (new DateTime(2019, 3, 1), 12.2),
                            new DataPoint (new DateTime(2019, 4, 1), 15.6),
                            new DataPoint (new DateTime(2019, 5, 1), 19.6),
                            new DataPoint (new DateTime(2019, 6, 1), 22.7),
                            new DataPoint (new DateTime(2019, 7, 1), 25.2),
                            new DataPoint (new DateTime(2019, 8, 1), 25),
                            new DataPoint (new DateTime(2019, 9, 1), 21.1),
                            new DataPoint (new DateTime(2019, 10, 1), 16.3),
                            new DataPoint (new DateTime(2019, 11, 1), 10.8),
                            new DataPoint (new DateTime(2019, 12, 1), 7.5)
                };
                }
                return dataPoints;
            }
        }
    }
    public class DataPoint {
        public DateTime Time { get; set; }
        public double Value { get; set; }
        public DataPoint(DateTime time, double value) {
            this.Time = time;
            this.Value = value;
        }
    }
}
Related GitHub Examples
The following code snippets (auto-collected from DevExpress Examples) contain references to the ColorEach property.
Note
The algorithm used to collect these code examples remains a work in progress. Accordingly, the links and snippets below may produce inaccurate results. If you encounter an issue with code examples below, please use the feedback form on this page to report the issue.