CountIntervalNumericScaleOptions.Count Property
In This Article
Gets or sets the number of intervals.
Namespace: DevExpress.Xpf.Charts
Assembly: DevExpress.Xpf.Charts.v24.2.dll
NuGet Package: DevExpress.Wpf.Charts
#Declaration
#Property Value
| Type | Description |
|---|---|
| Nullable<Int32> | The integer that specifies the number of intervals. |
#Example
This example demonstrates how to create a histogram chart with a given number of bins.
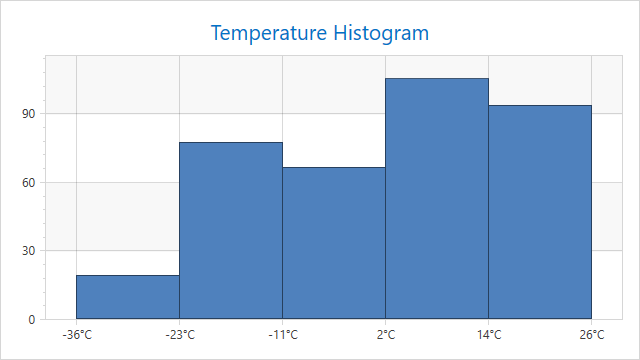
The code below configures a histogram for a chart with a numeric x-axis scale.
<dxc:ChartControl x:Name="chartControl">
    <dxc:XYDiagram2D>
        <dxc:XYDiagram2D.AxisX>
            <dxc:AxisX2D TickmarksMinorVisible="False"
                         GridLinesVisible="True">
                <dxc:AxisX2D.NumericScaleOptions>
                    <!-- Configure a histogram chart with the specified number of bins. -->
                    <dxc:CountIntervalNumericScaleOptions AggregateFunction="Histogram"
                                                          Count="5"
                                                          GridLayoutMode="GridAndLabelShifted"/>
                    <!--...-->
                </dxc:AxisX2D.NumericScaleOptions>
                <dxc:AxisX2D.Label>
                    <dxc:AxisLabel TextPattern="{}{A:F0}°C"/>
                </dxc:AxisX2D.Label>
                <dxc:AxisX2D.WholeRange>
                    <dxc:Range SideMarginsValue="0.8"/>
                </dxc:AxisX2D.WholeRange>
            </dxc:AxisX2D>
        </dxc:XYDiagram2D.AxisX>
        <dxc:BarSideBySideSeries2D  DisplayName="Temperature"
                                    DataSource="{Binding}"
                                    ArgumentDataMember="Temperature"
                                    BarWidth="1">
        </dxc:BarSideBySideSeries2D>
    </dxc:XYDiagram2D>
</dxc:ChartControl>
The following API members configure the histogram options:
| Member | Description |
|---|---|
| Count |
The options that provide means to configure a specified number of axis intervals. |
| Manual |
Gets or sets the function that is used to aggregate numeric axis data when one of the Axis |
Count |
Gets or sets the number of intervals. |
| Interval |
Gets or sets the value that specifies the alignment of grid lines, major tickmarks and axis labels. |
See Also