IntervalNumericScaleOptions.GridLayoutMode Property
Gets or sets the value that specifies the alignment of grid lines, major tickmarks and axis labels.
Namespace: DevExpress.Xpf.Charts
Assembly: DevExpress.Xpf.Charts.v26.1.dll
Declaration
Property Value
| Type | Description |
|---|---|
| GridLayoutMode | The value that specifies alignment. |
Available values:
| Name | Description |
|---|---|
| GridAndLabelCentered | A grid line, major tickmark, axis label are in an interval center.
|
| GridShiftedLabelCentered | A grid line and major tickmark are shifted to an interval start value. An axis label is in the interval center.
|
| GridAndLabelShifted | A grid line, major tickmark, axis label are shifted to an interval start value.
|
Remarks
The following alignments are available:
| The GridLayoutMode value | Image |
|---|---|
| GridAndLabelCentered |  |
| GridAndLabelShifted |  |
| GridShiftedLabelCentered |  |
When the GridAndLabelShifted mode is enabled, use the AxisLabel.TextPattern property to format the axis label text. Use the IntervalNumericScaleOptions.Pattern property when the GridAndLabelCentered or GridShiftedLabelCentered mode is enabled.
Example
This example demonstrates how to create a histogram chart with a given number of bins.
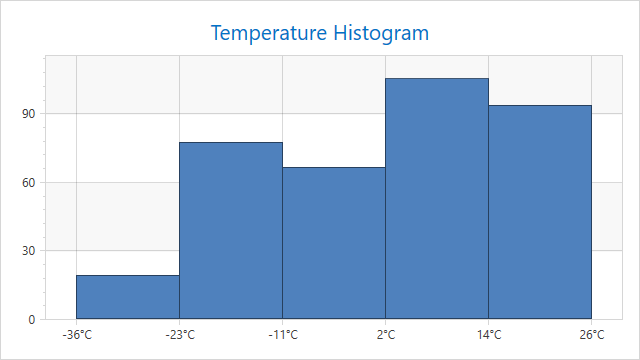
The code below configures a histogram for a chart with a numeric x-axis scale.
<dxc:ChartControl x:Name="chartControl">
    <dxc:XYDiagram2D>
        <dxc:XYDiagram2D.AxisX>
            <dxc:AxisX2D TickmarksMinorVisible="False"
                         GridLinesVisible="True">
                <dxc:AxisX2D.NumericScaleOptions>
                    <!-- Configure a histogram chart with the specified number of bins. -->
                    <dxc:CountIntervalNumericScaleOptions AggregateFunction="Histogram"
                                                          Count="5"
                                                          GridLayoutMode="GridAndLabelShifted"/>
                    <!--...-->
                </dxc:AxisX2D.NumericScaleOptions>
                <dxc:AxisX2D.Label>
                    <dxc:AxisLabel TextPattern="{}{A:F0}°C"/>
                </dxc:AxisX2D.Label>
                <dxc:AxisX2D.WholeRange>
                    <dxc:Range SideMarginsValue="0.8"/>
                </dxc:AxisX2D.WholeRange>
            </dxc:AxisX2D>
        </dxc:XYDiagram2D.AxisX>
        <dxc:BarSideBySideSeries2D  DisplayName="Temperature"
                                    DataSource="{Binding}"
                                    ArgumentDataMember="Temperature"
                                    BarWidth="1">
        </dxc:BarSideBySideSeries2D>
    </dxc:XYDiagram2D>
</dxc:ChartControl>
The following API members configure the histogram options:
| Member | Description |
|---|---|
| CountIntervalNumericScaleOptions | The options that provide means to configure a specified number of axis intervals. |
| ManualNumericScaleOptions.AggregateFunction | Gets or sets the function that is used to aggregate numeric axis data when one of the AxisX2D.NumericScaleOptions, AxisX3D.NumericScaleOptions, or CircularAxisX2D.NumericScaleOptions properties is set to ManualNumericScaleOptions. |
| CountIntervalNumericScaleOptions.Count | Gets or sets the number of intervals. |
IntervalNumericScaleOptions.GridLayoutMode |
Gets or sets the value that specifies the alignment of grid lines, major tickmarks and axis labels. |