AreaEmptyPointOptions.Border Property
Gets or sets border settings for empty point areas.
Namespace: DevExpress.Xpf.Charts
Assembly: DevExpress.Xpf.Charts.v24.2.dll
NuGet Package: DevExpress.Wpf.Charts
#Declaration
public SeriesBorder Border { get; set; }#Property Value
| Type | Description |
|---|---|
| Series |
Specifies border settings. |
#Property Paths
You can access this nested property as listed below:
| Object Type | Path to Border |
|---|---|
| Area |
|
| Area |
|
| Range |
|
#Example
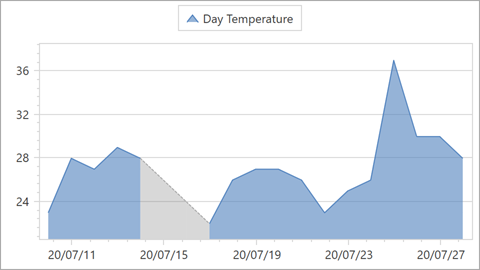
This example shows how to customize display options for empty points of an area series.

Assign an AreaEmptyPointOptions object to the AreaSeries2D.EmptyPointOptions property to customize empty point settings of the area series.
Specify the EmptyPointOptions.ProcessPoints property to define how the chart handles empty points. In this example, the chart calculates mock values for empty points.
Use the EmptyPointOptions.Brush property to paint areas that display empty points.
<dxc:AreaSeries2D DisplayName="Day Temperature"
                  ArgumentDataMember="Date"
                  ValueDataMember="DayTemperature"
                  Transparency="0.4">
    <dxc:AreaSeries2D.EmptyPointOptions>
        <dxc:AreaEmptyPointOptions ProcessPoints="Interpolate"
                                   Brush="#80808080">
            <dxc:AreaEmptyPointOptions.Border>
                <dxc:SeriesBorder Brush="DarkGray">
                    <dxc:SeriesBorder.LineStyle>
                        <dxc:LineStyle>
                            <dxc:LineStyle.DashStyle>
                                <DashStyle Dashes="2 2"/>
                            </dxc:LineStyle.DashStyle>
                        </dxc:LineStyle>
                    </dxc:SeriesBorder.LineStyle>
                </dxc:SeriesBorder>
            </dxc:AreaEmptyPointOptions.Border>
        </dxc:AreaEmptyPointOptions>
    </dxc:AreaSeries2D.EmptyPointOptions>
</dxc:AreaSeries2D>