Series Scale Types
- 2 minutes to read
This document explains the advantages that different scale types offer when defined for series arguments and values.
The scale type determines how a chart interprets the data provided for the arguments and values of points.
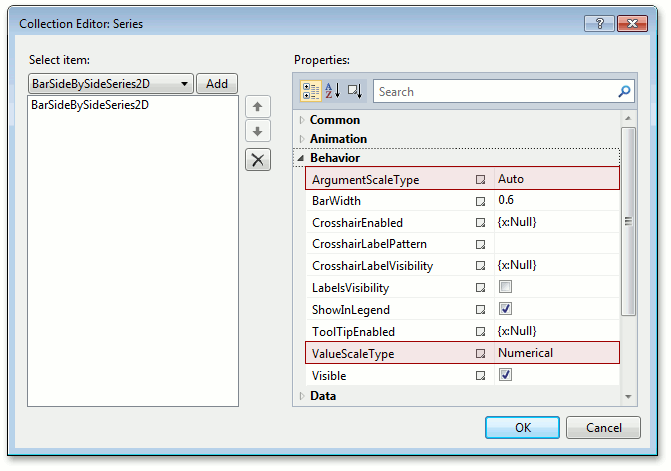
Argument and value scale types are defined via the Series.ArgumentScaleType and Series.ValueScaleType properties. Each scale type provides the capability to format data (e.g., currency, percent or date-time) that affects both the series and the axis labels.
Note
You do not need to specify the Series.ArgumentScaleType property (set to the Auto mode by default) because the type of series points’ arguments is detected automatically based on the type of underlying data.
There are four scale types available.
-
Note that the Qualitative scale type can only be applied to series arguments because with this scale type, individual point values are treated as strings that can only be sorted, aggregated and filtered based on these values.
-
This is the default scale type for the Series.ValueScaleType property.
-
This scale type is available for both the series arguments and values.
-
This scale type is available for both the series arguments and values.
Note
If the DateTime or TimeSpan scale type is assigned for point values and/or arguments, you can use the SeriesPoint.DateTimeValue(SeriesPoint.TimeSpanValue) and SeriesPoint.DateTimeArgument(SeriesPoint.TimeSpanArgument) properties to obtain the date-time representation of these values.
Additionally, a series scale type defines the scale of the associated axes, and each scale type provides a specific set of configurations available for an axis range. However, an axis range can be defined irrespective of the scale type being used, via the AxisRange.MinValueInternal and AxisRange.MaxValueInternal properties.