Axis2D.TitlePosition Property
Gets or sets the axis title position.
Namespace: DevExpress.Xpf.Charts
Assembly: DevExpress.Xpf.Charts.v25.2.dll
NuGet Package: DevExpress.Wpf.Charts
Declaration
Property Value
| Type | Description |
|---|---|
| AxisTitlePosition | The value that defines the axis title position. |
Available values:
| Name | Description |
|---|---|
| Outside | The axis title is outside of the chart plot area. |
| Inside | The axis title is inside of the chart plot area. |
Remarks
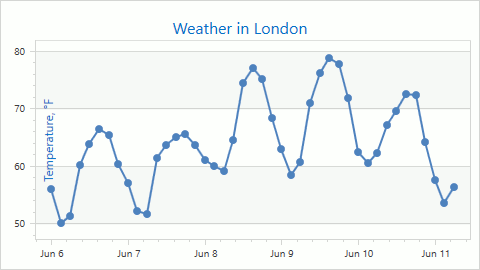
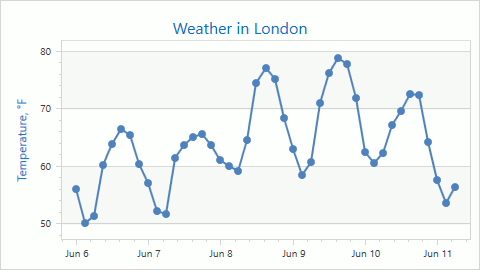
The following table lists values you can use to specify the TitlePosition property:
| Value | Description |
|---|---|
| Inside |  |
| Outside |  |
Example
This example illustrates how to configure the axis element appearance and layout:

The following markup configures options of a y-axis to resemble to its appearance in the image above:
<dxc:XYDiagram2D.AxisY>
    <dxc:AxisY2D TitlePosition="Outside"
                 LabelPosition="Inside"
                 LabelAlignment="Far"
                 Alignment="Near">
        <dxc:AxisY2D.NumericScaleOptions>
            <dxc:ContinuousNumericScaleOptions AutoGrid="False"
                                               GridSpacing="10"/>
        </dxc:AxisY2D.NumericScaleOptions>
        <dxc:AxisY2D.WholeRange>
            <dxc:Range dxc:AxisY2D.AlwaysShowZeroLevel="False"/>
        </dxc:AxisY2D.WholeRange>
        <dxc:AxisY2D.Label>
            <dxc:AxisLabel TextPattern="{}{V} °F"
                           FontSize="10"/>
        </dxc:AxisY2D.Label>
        <dxc:AxisY2D.Title>
            <dxc:AxisTitle Content="Temperature"
                           Visible="True"
                           Alignment="Center"
                           FontSize="12"/>
        </dxc:AxisY2D.Title>
    </dxc:AxisY2D>
</dxc:XYDiagram2D.AxisY>
The following table lists the API members the example above uses:
| Member | Description |
|---|---|
Axis2D.TitlePosition |
Gets or sets the axis title position. |
| Axis2D.LabelPosition | Gets or sets the axis label position. |
| Axis2D.LabelAlignment | Gets or sets the axis label alignment. This is a dependency property. |
| Axis2D.Alignment | Gets or sets the axis alignment. This is a dependency property. |
| AxisY2D.NumericScaleOptions | Provides access to the options that define the behavior of a numeric Y-scale when its mode is continuous. |
| ContinuousNumericScaleOptions | Contains settings for numeric axis data when its scale mode is continuous. |
| Axis.WholeRange | Gets or sets the range through which it’s possible to scroll an axis. |
| Range | Contains the common settings that define the range displayed by an axis. |
| AxisBase.Label | Specifies axis label settings. |
| AxisLabel | Contains settings for axis labels. |
| Axis.Title | Provides access to the title settings of an axis. |
| AxisTitle | Defines the common settings of an axis title. |
See Also