SimpleDiagram2D.Dimension Property
Gets or sets the number of pie charts that can be displayed in one line (row or column).
Namespace: DevExpress.Xpf.Charts
Assembly: DevExpress.Xpf.Charts.v26.1.dll
Declaration
Property Value
| Type | Description |
|---|---|
| Int32 | A positive integer that specifies the number of pie charts in one line. |
Remarks
The Dimension property can be used along with the SimpleDiagram2D.LayoutDirection property to adjust the layout of pie charts within the diagram. Depending upon the SimpleDiagram2D.LayoutDirection property’s value, pie charts are positioned in either horizontal lines (by rows) or vertically (by columns). The Dimension property specifies how many pie charts can be displayed within one row or column.
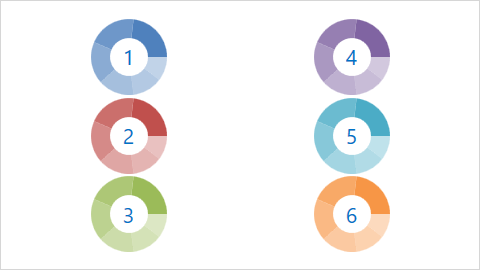
The following images show the Dimension property in action:
| Property Value | Example |
|---|---|
| Dimension = “2” (LayoutDirection = “Vertical”) |
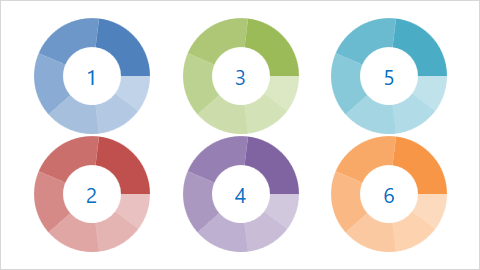 |
| Dimension = “3” (LayoutDirection = “Vertical”) |
 |
Note
The Dimension property is calculated automatically during resizing when the ChartControlBase.AutoLayout property is set to true.
A pie chart(s) that is displayed within an incomplete row or column automatically changes its size to try and occupy all of the available free space.
Example
This example shows how to use the SimpleDiagram2D.LayoutDirection and SimpleDiagram2D.Dimension properties to arrange multiple pies within a simple diagram.

<dxc:ChartControl AutoLayout="False">
    <dxc:SimpleDiagram2D LayoutDirection="Vertical" Dimension="3">
        <!-...-->
    </dxc:SimpleDiagram2D>
</dxc:ChartControl>