SidePoint.LabelDisplayMode Property
Specifies how the label of a side series point is displayed.
Namespace: DevExpress.Xpf.Charts
Assembly: DevExpress.Xpf.Charts.v26.1.dll
Declaration
Property Value
| Type | Description |
|---|---|
| SidePointDisplayMode | A SidePointDisplayMode enumeration value. |
Available values:
| Name | Description |
|---|---|
| Default | The label/marker uses common settings. |
| SeriesPoint | The control shows the label/marker next to the series point. If the label/marker should be outside a visual area when zooming or scrolling, the label/marker is displayed at the diagram’s edge. |
| DiagramEdge | The control displays the label/marker at the diagram edge. |
Remarks
The following values are available:
Value | Description | |
|---|---|---|
Default | The label uses common label settings. |
|
DiagramEdge | The control displays the label at the diagram edge. The SidePoint.Label property specifies appearance settings. |
|
SeriesPoint | The control shows the label next to the series point. If the label should be outside a visual area when zooming or scrolling, the label is displayed at the diagram’s edge. The SidePoint.Label property specifies appearance settings. |
|


Example
This example shows how to create a template that customizes the side point label appearance.
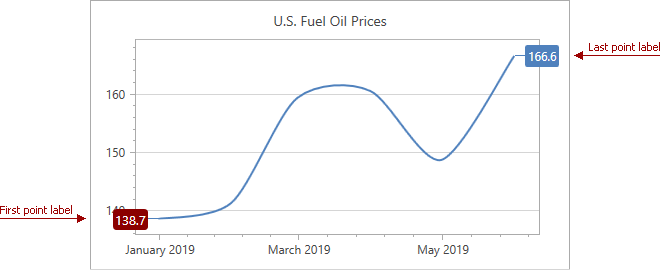
Use the XYSeries2D.FirstPoint and LastPoint properties to access side point options.
To show labels, set the SidePoint.LabelDisplayMode
property to SeriesPoint.
The markup below specifies SeriesLabel.ElementTemplate and customizes the first label appearance:
- background color
- text color
- font size
- border corner radius
- border thickness
The last point label uses default settings.
<Window.Resources>
    <ResourceDictionary>
        <DataTemplate x:Key="labelTemplate">
            <Border BorderThickness="1" CornerRadius="4" Opacity="1.0">
                <Border.Background>
                    <SolidColorBrush Color="DarkRed"/>
                </Border.Background>
                <Label Content="{Binding Path=Text}" Padding="2,2,2,1.5"
        Foreground="White" FontSize="13" />
            </Border>
        </DataTemplate>
    </ResourceDictionary>
</Window.Resources>
...
<dxc:ChartControl x:Name="ChartControl1" ...>
    <dxc:XYDiagram2D>
        <dxc:SplineSeries2D Name="xSplineSeries2D" LabelsVisibility="False" ...>
            <dxc:SplineSeries2D.FirstPoint>
                <dxc:SidePoint LabelDisplayMode="SeriesPoint">
                    <dxc:SidePoint.Label>
                        <dxc:SeriesLabel ElementTemplate="{StaticResource labelTemplate}"/>
                    </dxc:SidePoint.Label>
                </dxc:SidePoint>
            </dxc:SplineSeries2D.FirstPoint>
            <dxc:SplineSeries2D.LastPoint>
                <dxc:SidePoint LabelDisplayMode="SeriesPoint">
                </dxc:SidePoint>
            </dxc:SplineSeries2D.LastPoint>
        </dxc:SplineSeries2D>
                ...
    </dxc:XYDiagram2D>
           ...
</dxc:ChartControl>
Related GitHub Examples
The following code snippet (auto-collected from DevExpress Examples) contains a reference to the LabelDisplayMode property.
Note
The algorithm used to collect these code examples remains a work in progress. Accordingly, the links and snippets below may produce inaccurate results. If you encounter an issue with code examples below, please use the feedback form on this page to report the issue.