ContinuousTimeSpanScaleOptions.GridAlignment Property
Gets or sets the time-span measurement unit that defines the alignment of grid lines and axis labels.
Namespace: DevExpress.Xpf.Charts
Assembly: DevExpress.Xpf.Charts.v26.1.dll
Declaration
Property Value
| Type | Description |
|---|---|
| TimeSpanGridAlignment | A measurement unit that defines how to align the axis major grid lines and labels. |
Available values:
| Name | Description |
|---|---|
| Millisecond | Specifies the millisecond measurement unit. |
| Second | Specifies the second measurement unit. |
| Minute | Specifies the minute measurement unit. |
| Hour | Specifies the hour measurement unit. |
| Day | Specifies the day measurement unit. |
Property Paths
You can access this nested property as listed below:
| Object Type | Path to GridAlignment |
|---|---|
| AxisY2D |
|
| AxisY3D |
|
| CircularAxisY2D |
|
Remarks
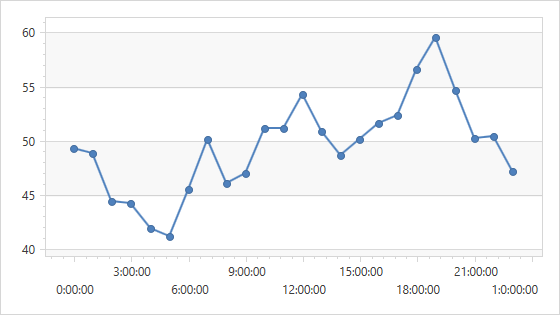
The following images show charts with different grid alignments (GridSpacing is set to 1).
| Value | Image |
|---|---|
| GridAlignment = “Hour” |  |
| GridAlignment = “Day” |  |
Disable the AutoGrid property before you specify GridAlignment.
Example
This example shows how to configure a continuous time-span scale options of an x-axis.
<Window
        xmlns="http://schemas.microsoft.com/winfx/2006/xaml/presentation"
        xmlns:x="http://schemas.microsoft.com/winfx/2006/xaml"
        xmlns:d="http://schemas.microsoft.com/expression/blend/2008"
        xmlns:mc="http://schemas.openxmlformats.org/markup-compatibility/2006"
        xmlns:local="clr-namespace:TimeSpanExample"
        xmlns:dxc="http://schemas.devexpress.com/winfx/2008/xaml/charts"
        x:Class="TimeSpanExample.MainWindow"
        mc:Ignorable="d"
        Title="MainWindow" Height="450" Width="800">
    <Window.DataContext>
        <local:ChartViewModel/>
    </Window.DataContext>
    <Grid>
        <dxc:ChartControl>
            <dxc:XYDiagram2D>
                <dxc:XYDiagram2D.AxisX>
                    <dxc:AxisX2D>
                        <dxc:AxisX2D.TimeSpanScaleOptions>
                            <dxc:ContinuousTimeSpanScaleOptions GridAlignment="Hour"
                                                                GridSpacing="3"
                                                                AutoGrid="False"/>
                        </dxc:AxisX2D.TimeSpanScaleOptions>
                    </dxc:AxisX2D>
                </dxc:XYDiagram2D.AxisX>
                <!-- Other diagram settings. -->
            </dxc:XYDiagram2D>
        </dxc:ChartControl>
    </Grid>
</Window>
Related API:
| Member | Description |
|---|---|
| AxisX2D.TimeSpanScaleOptions | Gets or sets options of the time-span scale used by the argument axis. |
| ContinuousTimeSpanScaleOptions | Contains settings for an axis with a continuous time-span scale. |
ContinuousTimeSpanScaleOptions.GridAlignment |
Gets or sets the time-span measurement unit that defines the alignment of grid lines and axis labels. |
| ContinuousTimeSpanScaleOptions.GridSpacing | Gets or sets a value that specifies the distance between major tickmarks and grid lines. |
| ContinuousTimeSpanScaleOptions.AutoGrid | Gets or sets a value that specifies whether the GridSpacing and GridAlignment property values are automatically calculated. |