ChartCalculatedField.FieldType Property
Gets or sets the type of calculated field values.
Namespace: DevExpress.Xpf.Charts
Assembly: DevExpress.Xpf.Charts.v26.1.dll
Declaration
Property Value
| Type |
|---|
| ChartCalculatedFieldType |
Available values:
| Name | Description |
|---|---|
| None | Indicates that the field’s type is undefined and determined based on the returned object during chart initialization. |
| String | Indicates that the field returns a string value as a sequence of UTF-16 code units (the String type). |
| DateTime | Indicates that the field returns a value expressed as a date and time of day (the DateTime type). |
| TimeSpan | Indicates that the field returns a value as a time interval (the TimeSpan type). |
| Byte | Indicates that the field returns an 8-bit unsigned integer value (the Byte type). |
| Int16 | Indicates that the field returns a 16-bit signed integer value (the Int16 type). |
| Int32 | Indicates that the field returns a 32-bit signed integer value (the Int32 type). |
| Float | Indicates that the field returns a single-precision floating-point value (the Single type). |
| Double | Indicates that the field returns a double-precision floating-point value (the Double type). |
| Decimal | Indicates that the field returns a decimal value (the Decimal type). |
| Boolean | Indicates that the field returns a Boolean (true or false) value (the Boolean type). |
| Guid | Indicates that the field returns a global unique identifier value (the Guid type). |
Remarks
The FieldType property specifies the type of values (Boolean, DateTime, String, etc.) a calculated field returns after its expression is evaluated. The ChartCalculatedFieldType enumeration lists the available types.
Example
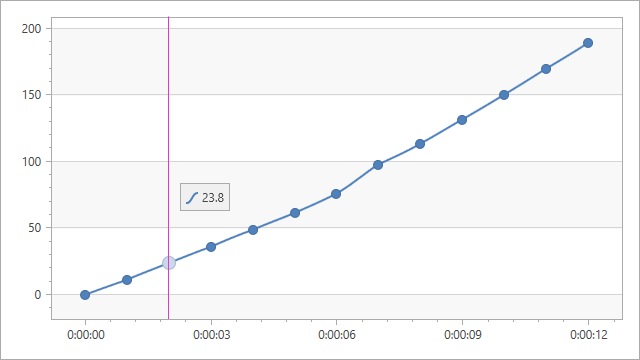
The following example shows how to create a calculated field and then use this field as a data source for a series. The field’s values are calculated by the following expression: [Time.Seconds] * [Velocity].
<dxc:ChartControl x:Name="chartControl">
    <dxc:ChartControl.DataContext>
        <local:ChartViewModel/>
    </dxc:ChartControl.DataContext>
    <dxc:ChartControl.CalculatedFields>
        <dxc:ChartCalculatedField FieldName="Displacement"
                                  Expression="[Time.Seconds] * [Velocity]"
                                  FieldType="Double"/>
    </dxc:ChartControl.CalculatedFields>
    <dxc:XYDiagram2D>
        <dxc:SplineSeries2D DisplayName="Series"
                            DataSource="{Binding DataPoints}"
                            ArgumentDataMember="Time"
                            ValueDataMember="Displacement"
                            CrosshairLabelPattern="{}{Displacement:f1}"
                            MarkerVisible="True"/>
        ...
    </dxc:XYDiagram2D>
</dxc:ChartControl>