WaterfallValueOptionsBase.ShowTotal Property
Gets or sets whether to show the total bar.
Namespace: DevExpress.Xpf.Charts
Assembly: DevExpress.Xpf.Charts.v26.1.dll
Declaration
Property Value
| Type | Description |
|---|---|
| Boolean |
|
Remarks
To change the total bar label, specify the TotalLabel property. Use the WaterfallSeries2D.TotalBarBrush property to set the total bar’s fill color.
Example
This example shows how to create a waterfall chart.
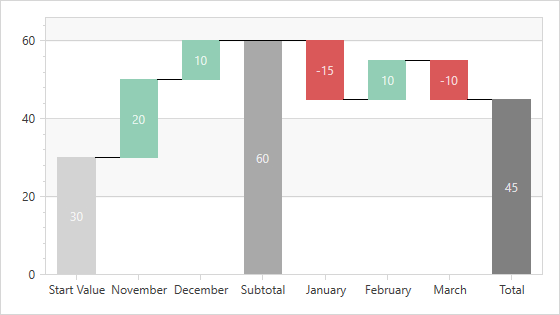
Create a ChartControl and specify its ChartControl.Diagram property to an XYDiagram2D object. Note that the ChartControl.Diagram is a content property. You can declare a diagram in XAML directly after a chart control’s declaration without wrapping it in opening and closing ChartControl.Diagram tags.
Add a WaterfallSeries2D object to the Diagram.Series collection. Note that the Diagram.Series is a content property. You can declare series in XAML directly after a diagram’s declaration without wrapping them in opening and closing Diagram.Series tags.
Use the following properties to bind the series to data:
- Series.DataSource - Specifies the series’s data source.
- Series.ArgumentDataMember - Defines the data member that provides the series’s arguments.
- Series.ValueDataMember - Specifies the data member that provides the series’s values.
Use the WaterfallSeries2D.ValueOptions property to set value options. If data source stores value differences, use the WaterfallRelativeValueOptions. Use the WaterfallAbsoluteValueOptions class if the data source stores absolute data values.
Markup:
<Window
        xmlns="http://schemas.microsoft.com/winfx/2006/xaml/presentation"
        xmlns:x="http://schemas.microsoft.com/winfx/2006/xaml"
        xmlns:d="http://schemas.microsoft.com/expression/blend/2008"
        xmlns:mc="http://schemas.openxmlformats.org/markup-compatibility/2006"
        xmlns:local="clr-namespace:WaterfallChart"
        xmlns:dxc="http://schemas.devexpress.com/winfx/2008/xaml/charts"
        x:Class="WaterfallChart.MainWindow"
        mc:Ignorable="d"
        Title="MainWindow" Height="500" Width="800">
    <Grid>
        <dxc:ChartControl>
            <dxc:XYDiagram2D dxc:WaterfallSeries2D.TotalBarBrush="Gray"
                             dxc:WaterfallSeries2D.StartBarBrush="LightGray"
                             dxc:WaterfallSeries2D.SubtotalBarBrush="DarkGray"
                             dxc:WaterfallSeries2D.ConnectorBrush="Black">
                <dxc:WaterfallSeries2D.ValueOptions>
                    <dxc:WaterfallRelativeValueOptions StartBarValue="30"
                                                       StartBarLabel="Start Value"
                                                       ShowTotal="True"
                                                       TotalLabel="Total">
                        <dxc:WaterfallRelativeValueOptions.Subtotals>
                            <dxc:Subtotal PointIndex="2" Label="Subtotal"/>
                        </dxc:WaterfallRelativeValueOptions.Subtotals>
                    </dxc:WaterfallRelativeValueOptions>
                </dxc:WaterfallSeries2D.ValueOptions>
                <dxc:WaterfallSeries2D DisplayName="Waterfall"
                                       LabelsVisibility="True"
                                       DataSource="{Binding}"
                                       ArgumentScaleType="Qualitative"
                                       ArgumentDataMember="Argument"
                                       ValueDataMember="Value"
                                       RisingBarBrush="#FF92CEB5"
                                       FallingBarBrush="#FFDA5859">
                    <dxc:WaterfallSeries2D.Model>
                        <dxc:BorderlessSimpleWaterfall2DModel/>
                    </dxc:WaterfallSeries2D.Model>
                </dxc:WaterfallSeries2D>
                <dxc:XYDiagram2D.AxisX>
                    <dxc:AxisX2D TickmarksMinorVisible="False"/>
                </dxc:XYDiagram2D.AxisX>
            </dxc:XYDiagram2D>
        </dxc:ChartControl>
    </Grid>
</Window>
Code-behind:
using System.Collections.Generic;
using System.Windows;

namespace WaterfallChart {
    /// <summary>
    /// Interaction logic for MainWindow.xaml
    /// </summary>
    public partial class MainWindow : Window {
        public MainWindow() {
            InitializeComponent();
            this.DataContext = DataLoader.GetDataPoints();
        }
    }
    class DataLoader {
        public static List<DataPoint> GetDataPoints() {
            List<DataPoint> list = new List<DataPoint> {
                new DataPoint("November", 20),
                new DataPoint("December", 10),
                new DataPoint("January", -15),
                new DataPoint("February", 10),
                new DataPoint("March", -10)
            };
            return list;
        }
    }
    public class DataPoint {
        public string Argument { get; private set; }
        public double Value { get; private set; }
        public DataPoint(string arg, double val) {
            Argument = arg;
            Value = val;
        }
    }
}