ManualTimeSpanScaleOptions.AggregateFunction Property
Gets or sets the function that is used to aggregate time-span data associated with the axis.
Namespace: DevExpress.Xpf.Charts
Assembly: DevExpress.Xpf.Charts.v26.1.dll
Declaration
Property Value
| Type | Description |
|---|---|
| AggregateFunction | An aggregate function applied to data. |
Available values:
| Name | Description |
|---|---|
| None | The aggregate function is not applied. |
| Average | Aggregates data by calculating the average value for a selected numeric or date-time interval. |
| Minimum | Aggregates data by calculating the minimum value for a selected numeric or date-time interval. |
| Maximum | Aggregates data by calculating the maximum value for a selected numeric or date-time interval. |
| Sum | Aggregates data by calculating the summary for a selected numeric or date-time interval. |
| Count | Aggregates data by calculating the number of non-null values for a selected numeric or date-time interval. |
| Histogram | Aggregates data by calculating the number of all points for a selected numeric or date-time interval. |
| Financial | Aggregates financial data for a selected interval into a single high-low-open-close data point, so that the high value equals the highest value of all data points in this interval; the low value equals the lowest value of all data points; the open value equals the value of the first data point and the close value equals the value of the last data point. |
| Custom | Aggregates data using the custom CustomAggregateFunction calculator. |
Remarks
The Chart Control can use an aggregate function to group raw data source values and show aggregates as series points. When the AggregateFunction property is not specified, the Chart uses the Average function. For more information, see the Aggregation help topic.
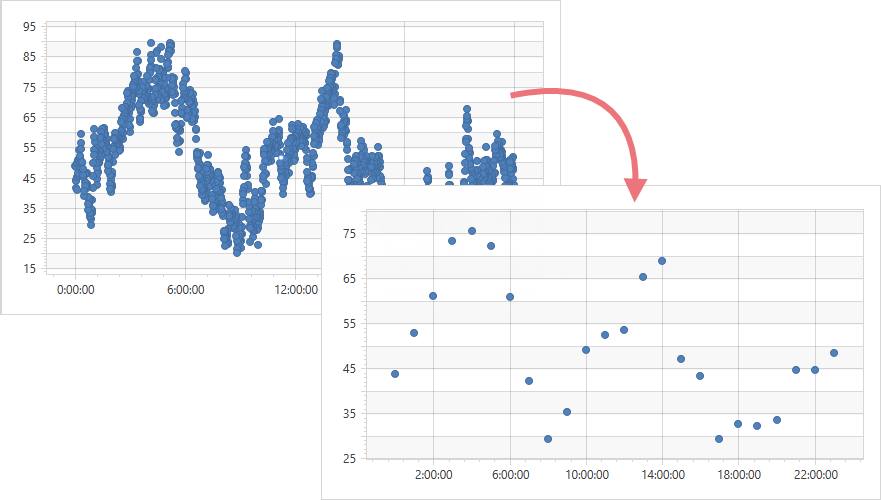
The following images show how changes to the aggregate function and measure unit affect the representation of minute-by-minute chart data.
MeasureUnit = “Minute”; AggregateFunction = “None”:

MeasureUnit = “Hour”; AggregateFunction = “None”:

MeasureUnit = “Hour”; AggregateFunction = “Average”:

Example
The following example shows how to group minute-by-minute data into data points with a greater measurement unit (“Hour”).
- Use the ManualTimeSpanScaleOptions.MeasureUnit property to specify the measurement unit that should be greater than the initial data measurement unit.
To change an arithmetic function used for computing point aggregates, use
ManualTimeSpanScaleOptions.AggregateFunction.Optionally, you can specify the ManualTimeSpanScaleOptions.GridAlignment, ManualTimeSpanScaleOptions.GridSpacing, and ManualTimeSpanScaleOptions.GridOffset properties.
<Window
        xmlns="http://schemas.microsoft.com/winfx/2006/xaml/presentation"
        xmlns:x="http://schemas.microsoft.com/winfx/2006/xaml"
        xmlns:d="http://schemas.microsoft.com/expression/blend/2008"
        xmlns:mc="http://schemas.openxmlformats.org/markup-compatibility/2006"
        xmlns:local="clr-namespace:TimeSpanExample"
        xmlns:dxc="http://schemas.devexpress.com/winfx/2008/xaml/charts"
        x:Class="TimeSpanExample.MainWindow"
        mc:Ignorable="d"
        Title="MainWindow" Height="450" Width="800">
    <Window.DataContext>
        <local:ChartViewModel/>
    </Window.DataContext>
    <Grid>
        <dxc:ChartControl>
            <dxc:XYDiagram2D>
                <dxc:XYDiagram2D.AxisX>
                    <dxc:AxisX2D>
                        <dxc:AxisX2D.TimeSpanScaleOptions>
                            <dxc:ManualTimeSpanScaleOptions GridAlignment="Hour"
                                                            GridSpacing="4"
                                                            MeasureUnit="Hour"
                                                            AggregateFunction="Average"
                                                            GridOffset="2"
                                                            AutoGrid="False"/>
                        </dxc:AxisX2D.TimeSpanScaleOptions>
                    </dxc:AxisX2D>
                </dxc:XYDiagram2D.AxisX>
                <!-- Other diagram settings. -->
            </dxc:XYDiagram2D>
        </dxc:ChartControl>
    </Grid>
</Window>