BoxPlotSeries2D.CapWidthPercentage Property
Gets or sets the cap width of a Box Plot series point as percentage.
Namespace: DevExpress.Xpf.Charts
Assembly: DevExpress.Xpf.Charts.v26.1.dll
Declaration
Property Value
| Type | Description |
|---|---|
| Double | A number that specifies the cap width as the percentage of box width. |
Remarks
Set the CapWidthPercentage property value to 100 to make the cap width equal to the box plot point width.
Example
This example shows how to create a Box Plot chart:
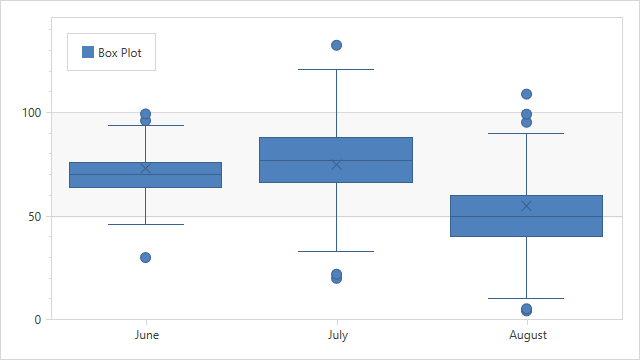
Create a ChartControl and specify its ChartControl.Diagram property to a XYDiagram2D object. Note that the ChartControl.Diagram is a content property. You can declare a diagram in XAML directly after a chart control’s declaration without wrapping it in opening and closing ChartControl.Diagram tags.
Add a BoxPlotSeries2D object to the Diagram.Series collection. Note that the Diagram.Series is a content property. You can declare series in XAML directly after a diagram’s declaration without wrapping them in opening and closing Diagram.Series tags.
Use the following properties to bind the series to data:
- Series.DataSource - Gets or sets a datasource which contains series data points.
- Series.ArgumentDataMember - Gets or sets the name of the data field which contains arguments for generated series points.
- BoxPlotSeries2D.MinValueDataMember - Gets or sets the name of the data field that contains the “Min” values for the Box Plot series.
- BoxPlotSeries2D.MaxValueDataMember - Gets or sets the name of the data field that contains the “Max” values for the Box Plot series.
- BoxPlotSeries2D.Quartile1ValueDataMember - Gets or sets the name of the data field that contains the “First Quartile” values for the Box Plot series.
- BoxPlotSeries2D.Quartile3ValueDataMember - Gets or sets the name of the data field that contains the “Third Quartile” values for the Box Plot series.
- BoxPlotSeries2D.MedianValueDataMember - Gets or sets the name of the data field that contains the “Median” values for the Box Plot series.
- BoxPlotSeries2D.MeanValueDataMember - Gets or sets the name of the data field that contains the “Mean” values for the Box Plot series. Optional parameter.
- BoxPlotSeries2D.OutlierValuesDataMember - Gets or sets the name of the data field that contains “Outliers” for the Box Plot series. Optional parameter.
The following properties allow you to customize the Box Plot chart appearance:
BoxPlotSeries2D.CapWidthPercentage- Gets or sets the cap width of a Box Plot series point as percentage.- BoxPlotSeries2D.BoxWidth - Gets or sets the Box Plot’s point width measured in axis units.
- BoxPlotSeries2D.Model - Gets or sets the model used to draw elements of a 2D Box Plot series.
Markup:
<Window
        xmlns="http://schemas.microsoft.com/winfx/2006/xaml/presentation"
        xmlns:x="http://schemas.microsoft.com/winfx/2006/xaml"
        xmlns:d="http://schemas.microsoft.com/expression/blend/2008"
        xmlns:mc="http://schemas.openxmlformats.org/markup-compatibility/2006"
        xmlns:local="clr-namespace:BoxPlotChart"
        xmlns:dxc="http://schemas.devexpress.com/winfx/2008/xaml/charts"
        x:Class="BoxPlotChart.MainWindow"
        mc:Ignorable="d"
        Title="MainWindow" Height="600" Width="800">
    <Window.DataContext>
        <local:ChartViewModel/>
    </Window.DataContext>
    <Grid>
        <dxc:ChartControl>
            <dxc:ChartControl.Legends>
                <dxc:Legend HorizontalPosition="Left"/>
            </dxc:ChartControl.Legends>
            <dxc:XYDiagram2D>
                <dxc:BoxPlotSeries2D DataSource="{Binding Data}"
                                     DisplayName="Box Plot"
                                     ArgumentDataMember="Argument"
                                     MinValueDataMember="Min"
                                     MaxValueDataMember="Max"
                                     Quartile1ValueDataMember="Quartile1"
                                     Quartile3ValueDataMember="Quartile3"
                                     MedianValueDataMember="Median"
                                     MeanValueDataMember="Mean"
                                     OutlierValuesDataMember="Outliers"
                                     CapWidthPercentage="50"
                                     BoxWidth="0.8">
                    <dxc:BoxPlotSeries2D.Model>
                        <dxc:SimpleBoxPlot2DModel/>
                    </dxc:BoxPlotSeries2D.Model>
                </dxc:BoxPlotSeries2D>
                <dxc:XYDiagram2D.AxisX>
                    <dxc:AxisX2D TickmarksMinorVisible="False"/>
                </dxc:XYDiagram2D.AxisX>
            </dxc:XYDiagram2D>
        </dxc:ChartControl>
    </Grid>
</Window>
Code-Behind:
using System.Collections.ObjectModel;
using System.Windows;
namespace BoxPlotChart {
    public partial class MainWindow : Window {
        public MainWindow() {
            InitializeComponent();
        }
    }
    public class ChartViewModel {
        public Collection<DataPoint> Data { get { return DataPoint.GetDataPoints(); } }
        public class DataPoint {
            public string Argument { get; set; }
            public double Min { get; set; }
            public double Max { get; set; }
            public double Quartile1 { get; set; }
            public double Quartile3 { get; set; }
            public double Median { get; set; }
            public double Mean { get; set; }
            public double[] Outliers { get; set; }
            public DataPoint(string argument, double min, double max, double q1, double q3, double median, double mean, double[] outliers) {
                this.Argument = argument;
                this.Min = min;
                this.Max = max;
                this.Quartile1 = q1;
                this.Quartile3 = q3;
                this.Median = median;
                this.Mean = mean;
                this.Outliers = outliers;
            }
            public static Collection<DataPoint> GetDataPoints() {
                Collection<DataPoint> data = new Collection<DataPoint> {
                    new DataPoint("June", 46, 94, 64, 76, 70, 73, new double[]{ 30, 96.3, 99.56 }),
                    new DataPoint("July", 33, 121, 66, 88, 77, 75, new double[]{ 20, 22, 132.7 }),
                    new DataPoint("August", 10, 90, 40, 60, 50, 55, new double[]{ 4, 5, 95.4, 99.3, 109 })
                };
                return data;
            }
        }
    }
}