NumericChartRangeControlClient Class
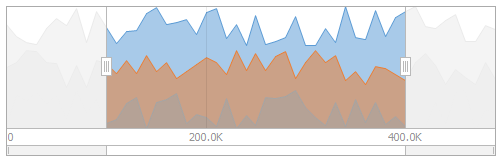
The RangeControl‘s client that renders a lightweight chart with a numeric horizontal axis.
Namespace: DevExpress.XtraEditors
Assembly: DevExpress.XtraEditors.v26.1.dll
Declaration
Remarks
To display data as a chart with a numeric (integer, float, double or decimal) horizontal axis in the RangeControl, assign a NumericChartRangeControlClient object to the RangeControl.Client property.
To set up a NumericChartRangeControlClient, use the following settings, which are accessible from the ChartRangeControlClientBase.DataProvider inherited property.
- ChartRangeControlClientDataProvider.DataSource - Gets or sets the chart range control client provider’s data source.
- ChartRangeControlClientDataProvider.ArgumentDataMember - Gets or sets the name of the data field that contains the arguments of the chart range control client’s points.
- ChartRangeControlClientDataProvider.ValueDataMember - Gets or sets the name of the data field that contains the point values of a chart range control client.
- ChartRangeControlClientDataProvider.SeriesDataMember (optionally) - Gets or sets the name of the data field whose values are used to automatically generate and populate the series of a chart range control client.
Example
This example shows how to bind a numeric chart range control client to a System.Collections.Generic.List containing NumericItem objects.
In order to provide data to a chart numeric range control client, you need to access the ChartRangeControlClientDataProvider object using the ChartRangeControlClientBase.DataProvider property and assign a data source to the ChartRangeControlClientDataProvider.DataSource property.
Each NumericItem object contains Argument, Value and Series properties, to which a numeric chart range control client is bound via its ChartRangeControlClientDataProvider.ArgumentDataMember, ChartRangeControlClientDataProvider.ValueDataMember, and ChartRangeControlClientDataProvider.SeriesDataMember (optional) properties.
In addition, this example shows how to customize chart client common settings (e.g., change the numeric range, customize template view and grid options).
using System;
using System.Collections.Generic;
using System.Drawing;
using System.Windows.Forms;
using DevExpress.XtraEditors;

namespace NumericChartClient {
    public partial class Form1 : Form {

        const int pointCount = 20;
        const int seriesCount = 2;
        Random rand = new Random();
        List<NumericItem> data = new List<NumericItem>();

        public Form1() {
            InitializeComponent();

            // Assign a numeric chart client to the Range control.
            rangeControl1.Client = numericChartRangeControlClient1;

            // Generate a list of NumericItem objects and bind the numeric chart client to it.
            numericChartRangeControlClient1.DataProvider.DataSource = GenerateNumericData();

            // Specify data members to bind the chart client.
            numericChartRangeControlClient1.DataProvider.ArgumentDataMember = "Argument";
            numericChartRangeControlClient1.DataProvider.ValueDataMember = "Value";
            numericChartRangeControlClient1.DataProvider.SeriesDataMember = "Series";

            // Specify the chart range control client view.
            AreaChartRangeControlClientView areaView = new AreaChartRangeControlClientView();
            numericChartRangeControlClient1.DataProvider.TemplateView = areaView;

            // Customize the area view appearance.
            areaView.AreaOpacity = 90;
            areaView.Color = Color.Gray;
            areaView.ShowMarkers = true;
            areaView.MarkerSize = 5;
            areaView.MarkerColor = Color.Red;

            // Specify the palette name to get a nice-looking chart.
            numericChartRangeControlClient1.PaletteName = "NatureColors";

            // Change the default range of the numeric chart range control client.
            numericChartRangeControlClient1.Range.Min = 4;
            numericChartRangeControlClient1.Range.Max = 12;

            // Customize the grid options of the numeric chart range control client.
            numericChartRangeControlClient1.GridOptions.GridSpacing = 2;
            numericChartRangeControlClient1.GridOptions.SnapSpacing = 1;
        }

        List<NumericItem> GenerateNumericData() {

            for (int seriesIndex = 0; seriesIndex < seriesCount; seriesIndex++) {
                for (int i = 0; i < pointCount; i++) {
                    data.Add(new NumericItem() {
                        Argument = i,
                        Value = rand.Next(0, 30) + i,
                        Series = seriesIndex
                    });
                }
            }
            return data;
        }
    }

    public class NumericItem {
        public double Argument { get; set; }
        public double Value { get; set; }
        public double Series { get; set; }
    }
}