MapPolylineSettings Class
Contains settings used to generate map polylines.
Namespace: DevExpress.Xpf.Map
Assembly: DevExpress.Xpf.Map.v25.2.dll
NuGet Package: DevExpress.Wpf.Map
Declaration
Related API Members
The following members return MapPolylineSettings objects:
Remarks
This class introduces the MapPolylineSettings.FillRule property that allows you to specify the fill rule of all generated map polylines.
Example
How to: Generate Polylines from a Data Source
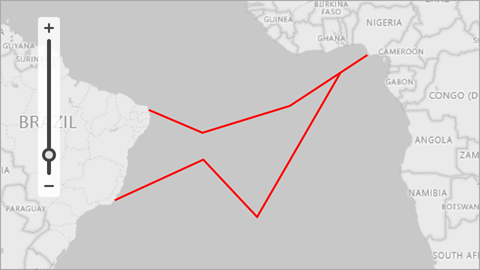
This example demonstrates how to generate map polylines based on data source objects and how to display these polylines on a vector layer.

Create a ListSourceDataAdapter object and assign it to the VectorLayer.Data property.
Specify the adapter’s DataSource property.
Create a MapMultipointItemMappingInfo object and assign it to the adapter’s Mappings property.
Map the following properties to data source fields:
- Points – Specifies a data source field that contains polyline points.
- Latitude – Specifies a data field that contains point latitudes. (Use the YCoordinate property for Cartesian coordinate systems.)
- Longitude – Specifies a data field that contains point longitudes. (Use the XCoordinate property for Cartesian coordinate systems.)
To specify the type of created map items, assign the appropriate settings to the ListSourceDataAdapter.ItemSettings property. In this example, use
MapPolylineSettingsto draw polylines.
<Window
        xmlns="http://schemas.microsoft.com/winfx/2006/xaml/presentation"
        xmlns:x="http://schemas.microsoft.com/winfx/2006/xaml"
        xmlns:d="http://schemas.microsoft.com/expression/blend/2008"
        xmlns:mc="http://schemas.openxmlformats.org/markup-compatibility/2006"
        xmlns:local="clr-namespace:MapApp"
        xmlns:dxm="http://schemas.devexpress.com/winfx/2008/xaml/map"
        x:Class="MapApp.MainWindow"
        mc:Ignorable="d"
        Title="MainWindow" Height="450" Width="800">
    <Grid>
        <dxm:MapControl x:Name="mapControl">
            <!-- You can optionally create a background image layer. -->
            <dxm:ImageLayer>
                <dxm:BingMapDataProvider Kind="RoadGray"
                                         BingKey="Insert your Bing key." />
            </dxm:ImageLayer>

            <dxm:VectorLayer x:Name="vectorLayer" DataLoaded="OnVectorLayerDataLoaded">
                <dxm:VectorLayer.Data>
                    <dxm:ListSourceDataAdapter x:Name="listSourceDataAdapter"
                                               DataSource="{Binding}">
                        <dxm:ListSourceDataAdapter.Mappings>
                            <dxm:MapMultipointItemMappingInfo Latitude="X"
                                                              Longitude="Y"
                                                              Points="PointSource"/>
                        </dxm:ListSourceDataAdapter.Mappings>
                        <dxm:ListSourceDataAdapter.ItemSettings>
                            <dxm:MapPolylineSettings Stroke="Red">
                                <dxm:MapPolylineSettings.StrokeStyle>
                                    <dxm:StrokeStyle Thickness="2"/>
                                </dxm:MapPolylineSettings.StrokeStyle>
                            </dxm:MapPolylineSettings>
                        </dxm:ListSourceDataAdapter.ItemSettings>
                    </dxm:ListSourceDataAdapter>
                </dxm:VectorLayer.Data>
            </dxm:VectorLayer>
        </dxm:MapControl>
    </Grid>
</Window>
using DevExpress.Xpf.Map;
using System.Collections.ObjectModel;
using System.Windows;
using System.Windows.Media;

namespace MapApp {
    public partial class MainWindow : Window {
        ObservableCollection<Line> Data { get; set; }
        public MainWindow() {
            InitializeComponent();

            Data = new ObservableCollection<Line>();

            Line line1 = new Line();
            line1.PointSource.Add(new Coordinate(-5.93107, -35.112723));
            line1.PointSource.Add(new Coordinate(-10.13507, -25.15696));
            line1.PointSource.Add(new Coordinate(-5.183714, -8.911391));
            line1.PointSource.Add(new Coordinate(4.253438, 5.47072));
            Data.Add(line1);

            Line line2 = new Line();
            line2.PointSource.Add(new Coordinate(1, 0.5));
            line2.PointSource.Add(new Coordinate(-25, -15));
            line2.PointSource.Add(new Coordinate(-15, -25));
            line2.PointSource.Add(new Coordinate(-22.1531, -41.45984));
            Data.Add(line2);

            this.DataContext = Data;
        }
        private void OnVectorLayerDataLoaded(object sender, DataLoadedEventArgs e) {
            mapControl.ZoomToFitLayerItems(new LayerBase[] { vectorLayer }, paddingFactor: 0.3);
        }
    }
    public struct Coordinate {
        public double X { get; }
        public double Y { get; }
        public Coordinate(double x, double y) {
            X = x;
            Y = y;
        }
    }

    public class Line {
        public ObservableCollection<Coordinate> PointSource { get; } = new ObservableCollection<Coordinate>();
    }
}