HeatmapProvider Class
Allows you to draw a heatmap on the Map Control surface.
Namespace: DevExpress.XtraMap
Assembly: DevExpress.XtraMap.v26.1.dll
Declaration
public class HeatmapProvider :
    FullRequestedDataProvider,
    IHeatImageContextProvider,
    IFullRequestedContextProvider,
    IUnitConverterProvider,
    IColorizerProvider,
ILegendDataProviderRemarks
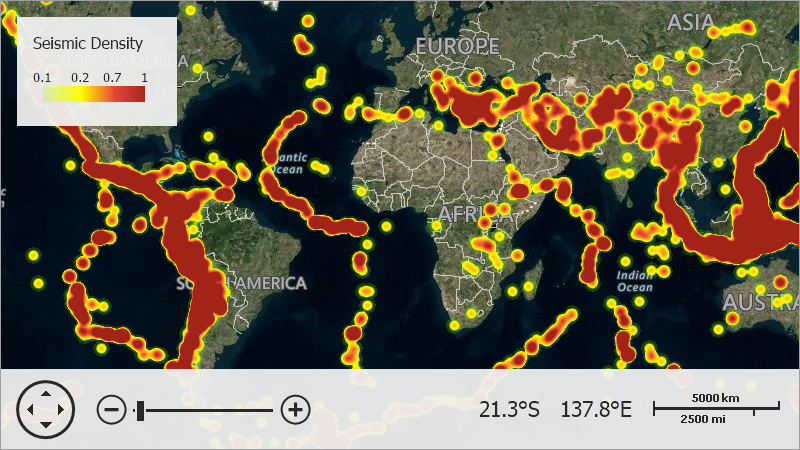
The following image shows a sample heatmap:
Follow the steps below to create a heatmap:
- Begin with an ImageLayer object and add it to the MapControl.Layers collection.
- Assign a HeatmapProvider object to the ImageLayer.DataProvider property.
Initialize the PointSource property to configure a source of heatmap points. Each heatmap point can be defined by its geo location and weight value (optional).
Use a HeatmapDataSourceAdapter object to generate points from a data source.
Alternatively, you can use a HeatmapPointStorage to plot a heatmap based on points created in code.
Specify an algorithm the Map Control should use to create a heatmap. Set the Algorithm property to a HeatmapDensityBasedAlgorithm object. At this time, this is the only available algorithm and it builds heatmaps based on point density. Additional algorithms will be implemented in future versions of this product.
using DevExpress.XtraMap; using System; using System.Data; using System.Drawing; using System.Windows.Forms; //... private void Form1_Load(object sender, EventArgs e) { HeatmapDataSourceAdapter adapter = new HeatmapDataSourceAdapter(); adapter.Mappings.XCoordinate = "glon"; // The data source field name that provides x-coordinates. adapter.Mappings.YCoordinate = "glat"; // The data source field name that provides y-coordinates. adapter.DataSource = LoadData("../../Data/Earthquakes.xml", "Row"); HeatmapProvider provider = new HeatmapProvider(); provider.PointSource = adapter; provider.Algorithm = new HeatmapDensityBasedAlgorithm { PointRadius = 8 }; ImageLayer heatmapLayer = new ImageLayer(); heatmapLayer.DataProvider = provider; mapControl1.Layers.Add(heatmapLayer); } DataTable LoadData(string filePath, string tableName) { DataSet xmlDataSet = new DataSet("XML DataSet"); xmlDataSet.ReadXml(filePath); return xmlDataSet.Tables[tableName]; }The XML file that is used as a data source has the following structure:
Show the structure```xml <?xml version="1.0"?> <Data> <xs:schema id="Data" xmlns:xs="http://www.w3.org/2001/XMLSchema" xmlns:msdata="urn:schemas-microsoft-com:xml-msdata"> <xs:element name="Data" msdata:IsDataSet="true" msdata:UseCurrentLocale="true"> <xs:complexType> <xs:choice minOccurs="0" maxOccurs="unbounded"> <xs:element name="Row"> <xs:complexType> <xs:sequence> <xs:element name="glat" type="xs:double" minOccurs="0" /> <xs:element name="glon" type="xs:double" minOccurs="0" /> </xs:sequence> </xs:complexType> </xs:element> </xs:choice> </xs:complexType> </xs:element> </xs:schema> <Row> <glat>36.475</glat> <glon>70.14</glon> </Row> <!--...--> </Data> ```To show a layer with a geographical map under the heatmap overlay, add an image layer and use one of image tile providers (for example,
BingMapDataProvider) to set the layer’s ImageLayer.DataProvider property.Configure the Color Scheme
You can use ChoroplethColorizer to change the predefined color scheme used to draw a heatmap. If heatmap points’ Value parameters are not specified, the control will color the heatmap based on point density alone. In this case, use values within the [0,1] range to set the color range boundaries (the ChoroplethColorizer.RangeStops property).
ChoroplethColorizer colorizer = new ChoroplethColorizer(); colorizer.RangeStops.AddRange(new double[] { 0.1, 0.2, 0.7, 1 }); colorizer.ColorItems.Add(new ColorizerColorItem(Color.FromArgb(50, 128, 255, 0))); colorizer.ColorItems.Add(new ColorizerColorItem(Color.FromArgb(255, 255, 255, 0))); colorizer.ColorItems.Add(new ColorizerColorItem(Color.FromArgb(255, 234, 72, 58))); colorizer.ColorItems.Add(new ColorizerColorItem(Color.FromArgb(255, 162, 36, 25))); colorizer.ApproximateColors = true; provider.Colorizer = colorizer;Related API members
- ChoroplethColorizer - Represents the Choropleth-like colorizer.
- ChoroplethColorizer.RangeStops - Gets range stops for the Choropleth colorizer.
- ChoroplethColorizer.ColorItems - Provides access to the collection of color items for this colorizer.
- ChoroplethColorizer.ApproximateColors - Gets or sets a value specifying whether to apply an approximation algorithm to colors in a colorizer.
- HeatmapProvider.Colorizer- Gets or sets the Choropleth colorizer used to paint the heatmap.
Tip
The following help topic describes the algorithm used to color heatmap points: HeatmapPoint.Value.
Add a Legend
Use the code below to add a legend with a gradient scale.
ColorScaleLegend legend = new ColorScaleLegend();
legend.Header = "Seismic Density";
legend.EnableGradientScale = true;
legend.Layer = heatmapLayer;
legend.HeaderStyle.Font = new Font("Tahoma", 12F);
mapControl1.Legends.Add(legend);
Related API members
- ColorScaleLegend - Represents a color legend as a color scale.
- MapLegendBase.Header - Gets or sets the header of the map legend.
- ColorScaleLegend.EnableGradientScale - Gets or sets whether a gradient applies across a legend‘s color items.
- ItemsLayerLegend.Layer - Specifies the layer from which the legend obtains data to display.
- MapLegendBase.HeaderStyle - Provides access to the style settings of the legend header.
- MapControl.Legends - Provides access to a collection of legends that are displayed within the Map control.