AxisStyle Class
Stores axis appearance settings.
Namespace: DevExpress.Maui.Charts
Assembly: DevExpress.Maui.Charts.dll
NuGet Package: DevExpress.Maui.Charts
Declaration
public class AxisStyle :
    StyleBase
Related API Members
The following members return AxisStyle objects:
Remarks
You can customize the x- and y-axis appearance to improve the readability of a chart’s visual data. To do this, create an AxisStyle object, specify its properties’ values, and assign this object to the axis’s Style property.
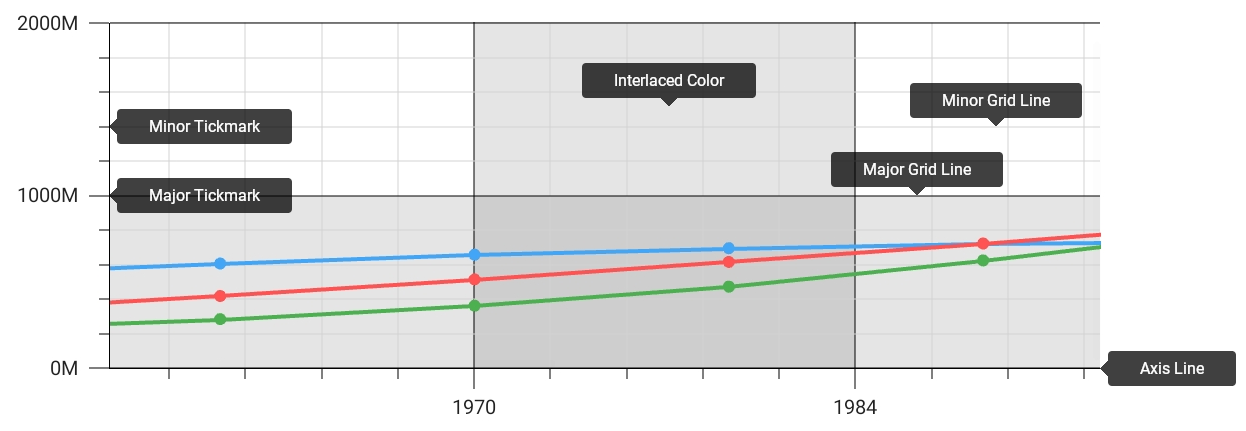
Tickmarks and Grid Lines
Tickmarks divide an axis into equal sections by a step whose value is determined by the special options of an axis.
Grid Lines are reference lines drawn across an axis from its tickmarks through the entire chart.
There are two types of tickmarks and grid lines: major and minor. Use the following properties to modify the appearance of tickmarks and grid lines:
Axis Elements | Properties |
|---|---|
Major tickmarks | |
Minor tickmarks | |
Major grid lines | |
Minor grid lines |
Axis Line
To customize an axis line, use the LineColor and LineThickness properties. The LineVisible property allows you to control the axis visibility.
Interlacing
You can make a diagram’s background striped by alternating two colors. To do this, set the InterlacedVisible property to DevExpress.Maui.Charts.DefaultBoolean.True, and specify the color using the InterlacedColor property.
Example
This example uses the AxisStyle class properties to customize axis lines, display grid lines and tickmarks with the specified appearance, and enable interlaced color intervals on the chart diagram.
<ContentPage xmlns="http://schemas.microsoft.com/dotnet/2021/maui"
             xmlns:x="http://schemas.microsoft.com/winfx/2009/xaml"
             x:Class="ChartAxesExample.MainPage"
             xmlns:dxc="clr-namespace:DevExpress.Maui.Charts;assembly=DevExpress.Maui.Charts">
  <ContentPage.Resources>
    <dxc:AxisStyle x:Key="axisStyle"
                   LineThickness="1" LineColor="Black"
                   MajorGridlinesVisible="True" MajorGridlinesThickness="1" MajorGridlinesColor="Black"
                   MinorGridLinesVisible="True" MinorGridlinesThickness="1" MinorGridlinesColor="LightGray"
                   MajorTickmarksVisible="True" MajorTickmarksThickness="1" MajorTickmarksLength="15"
                   MinorTickmarksVisible="True" MinorTickmarksThickness="1" MinorTickmarksLength="10"
                   InterlacedVisible="True" />
  </ContentPage.Resources>
  <dxc:ChartView>
    <!--...-->
    <dxc:ChartView.AxisX>
        <dxc:DateTimeAxisX Style="{StaticResource axisStyle}" />
    </dxc:ChartView.AxisX>
    <dxc:ChartView.AxisY>
        <dxc:NumericAxisY Style="{StaticResource axisStyle}"/>
    </dxc:ChartView.AxisY>
  </dxc:ChartView>
</ContentPage>