ValueBandPointColorizer Class
A value range colorizer that colors series points based on their Y-axis values.
Namespace: DevExpress.Maui.Charts
Assembly: DevExpress.Maui.Charts.dll
NuGet Package: DevExpress.Maui.Charts
Declaration
public class ValueBandPointColorizer :
    BandPointColorizerBase,
    IPointColorizer,
    IStackedPointColorizer,
    IWeightedPointColorizer
Remarks
Use this colorizer type to color points of a Point, Bar, Line, Area, RangeArea, StackedArea, StackedBar or Bubble series based on Y-axis values:
- Assign a ValueBandPointColorizer object to the series’s PointColorizer property (Line1PointColorizer/Line2PointColorizer for a range area series).
- Populate the colorizer’s ColorStops collection with ColorStop objects. Each ColorStop object defines a value range (a pair of Y-axis values) and color. If a Y-axis value falls within the range, the point is painted with this color.
Example
In this example, the bar chart displays cryptocurrency portfolio yield. It colors series points red when their Y-axis values are between -100 and 0, and green when values are between 0 and 100. Note that this chart diagram is rotated.
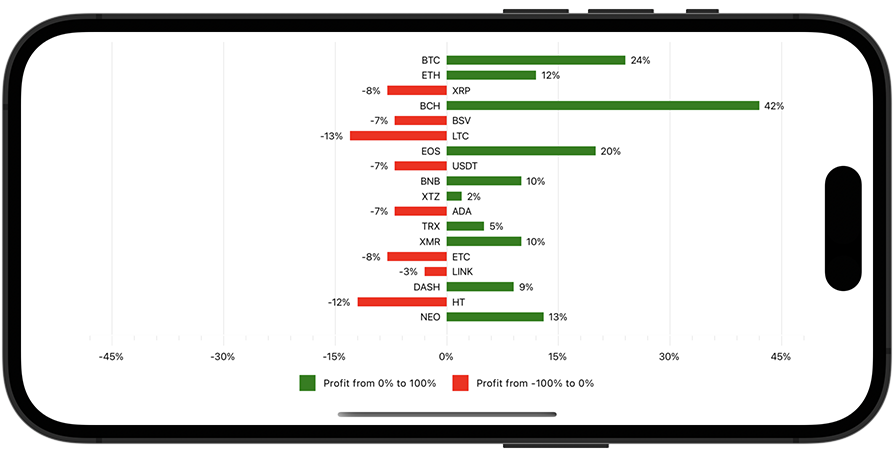
Create a data source – a list of objects each of which has the Ticker property that returns a string (point argument) and the Profit property that returns a number (point value).
using Microsoft.Maui.Graphics;
using System.Collections.Generic;

namespace ColorizerExample {
    public class ViewModel {
        public List<CryptocurrencyPortfolioItem> CryptocurrencyPortfolioData { get; }

        public ViewModel(){
            CryptocurrencyPortfolioData = new List<CryptocurrencyPortfolioItem>(){
                new CryptocurrencyPortfolioItem("NEO", 13),
                new CryptocurrencyPortfolioItem("HT", -12),
                new CryptocurrencyPortfolioItem("DASH", 9),
                new CryptocurrencyPortfolioItem("LINK", -3),
                new CryptocurrencyPortfolioItem("ETC", -8),
                new CryptocurrencyPortfolioItem("XMR", 10),
                new CryptocurrencyPortfolioItem("TRX", 5),
                new CryptocurrencyPortfolioItem("ADA", -7),
                new CryptocurrencyPortfolioItem("XTZ", 2),
                new CryptocurrencyPortfolioItem("BNB", 10),
                new CryptocurrencyPortfolioItem("USDT", -7),
                new CryptocurrencyPortfolioItem("EOS", 20),
                new CryptocurrencyPortfolioItem("LTC", -13),
                new CryptocurrencyPortfolioItem("BSV", -7),
                new CryptocurrencyPortfolioItem("BCH", 42),
                new CryptocurrencyPortfolioItem("XRP", -8),
                new CryptocurrencyPortfolioItem("ETH", 12),
                new CryptocurrencyPortfolioItem("BTC", 24),
            };
        }
    }

    public class CryptocurrencyPortfolioItem {
        public string Ticker { get; private set; }
        public double Profit { get; private set; }

        public CryptocurrencyPortfolioItem(string ticker, double profit) {
            Ticker = ticker;
            Profit = profit;
        }
    }
}
Assign a
ValueBandPointColorizerobject to the BarSeries.PointColorizer property. Populate the colorizer’s ColorStops collection with two ColorStop objects that specify colors for ranges of point values.<ContentPage xmlns:x="http://schemas.microsoft.com/winfx/2009/xaml" xmlns:dxc="clr-namespace:DevExpress.Maui.Charts;assembly=DevExpress.Maui.Charts" x:Class="ColorizerExample.MainPage" xmlns:local="clr-namespace:ColorizerExample"> <ContentPage.BindingContext> <local:ViewModel/> </ContentPage.BindingContext> <dxc:ChartView x:Name="chart" Rotated="True"> <dxc:ChartView.Series> <dxc:BarSeries LegendTextPattern="{}Profit from {CLV}% to {CHV}%"> <!-- Bind the series to the data source. --> <dxc:BarSeries.Data> <dxc:SeriesDataAdapter DataSource="{Binding CryptocurrencyPortfolioData}" ArgumentDataMember="Ticker"> <dxc:ValueDataMember Type="Value" Member="Profit"/> </dxc:SeriesDataAdapter> </dxc:BarSeries.Data> <dxc:BarSeries.Label> <dxc:BarSeriesLabel Position="Outside" Behavior="Cut" TextPattern="{}{V}%"/> </dxc:BarSeries.Label> <dxc:BarSeries.PointColorizer> <dxc:ValueBandPointColorizer> <dxc:ValueBandPointColorizer.ColorStops> <dxc:ColorStop Color="Green" Value1="0" Value2="100"/> <dxc:ColorStop Color="Red" Value1="0" Value2="-100"/> </dxc:ValueBandPointColorizer.ColorStops> </dxc:ValueBandPointColorizer> </dxc:BarSeries.PointColorizer> </dxc:BarSeries> </dxc:ChartView.Series> <!-- Specify axis and legend settings here. --> </dxc:ChartView> </ContentPage>