AxisStyle.LineColor Property
Gets or sets the axis line color. This is a bindable property.
Namespace: DevExpress.Maui.Charts
Assembly: DevExpress.Maui.Charts.dll
NuGet Package: DevExpress.Maui.Charts
Declaration
public Color LineColor { get; set; }Property Value
| Type | Description |
|---|---|
| Color | The axis line color. |
Remarks
To specify the axis line thickness, use the LineThickness property. To hide or show an axis line on a chart’s diagram, use the LineVisible property.
Example
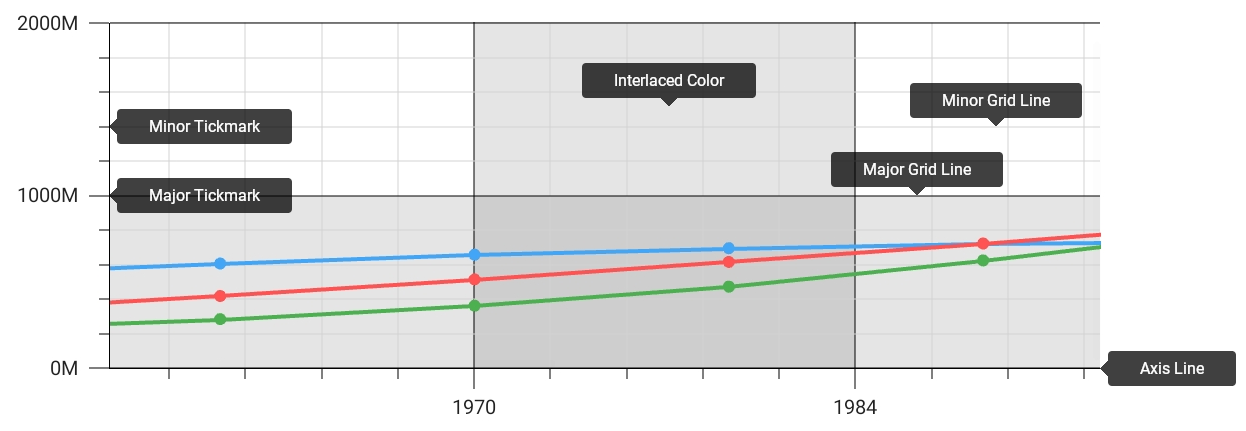
This example uses the AxisStyle class properties to customize axis lines, display grid lines and tickmarks with the specified appearance, and enable interlaced color intervals on the chart diagram.
<ContentPage xmlns="http://schemas.microsoft.com/dotnet/2021/maui"
             xmlns:x="http://schemas.microsoft.com/winfx/2009/xaml"
             x:Class="ChartAxesExample.MainPage"
             xmlns:dxc="clr-namespace:DevExpress.Maui.Charts;assembly=DevExpress.Maui.Charts">
  <ContentPage.Resources>
    <dxc:AxisStyle x:Key="axisStyle"
                   LineThickness="1" LineColor="Black"
                   MajorGridlinesVisible="True" MajorGridlinesThickness="1" MajorGridlinesColor="Black"
                   MinorGridLinesVisible="True" MinorGridlinesThickness="1" MinorGridlinesColor="LightGray"
                   MajorTickmarksVisible="True" MajorTickmarksThickness="1" MajorTickmarksLength="15"
                   MinorTickmarksVisible="True" MinorTickmarksThickness="1" MinorTickmarksLength="10"
                   InterlacedVisible="True" />
  </ContentPage.Resources>
  <dxc:ChartView>
    <!--...-->
    <dxc:ChartView.AxisX>
        <dxc:DateTimeAxisX Style="{StaticResource axisStyle}" />
    </dxc:ChartView.AxisX>
    <dxc:ChartView.AxisY>
        <dxc:NumericAxisY Style="{StaticResource axisStyle}"/>
    </dxc:ChartView.AxisY>
  </dxc:ChartView>
</ContentPage>
See Also