AxisBase.Style Property
Gets or sets the axis appearance settings. This is a bindable property.
Namespace: DevExpress.Maui.Charts
Assembly: DevExpress.Maui.Charts.dll
NuGet Package: DevExpress.Maui.Charts
#Declaration
public AxisStyle Style { get; set; }#Property Value
| Type | Description |
|---|---|
| Axis |
An Axis |
#Remarks
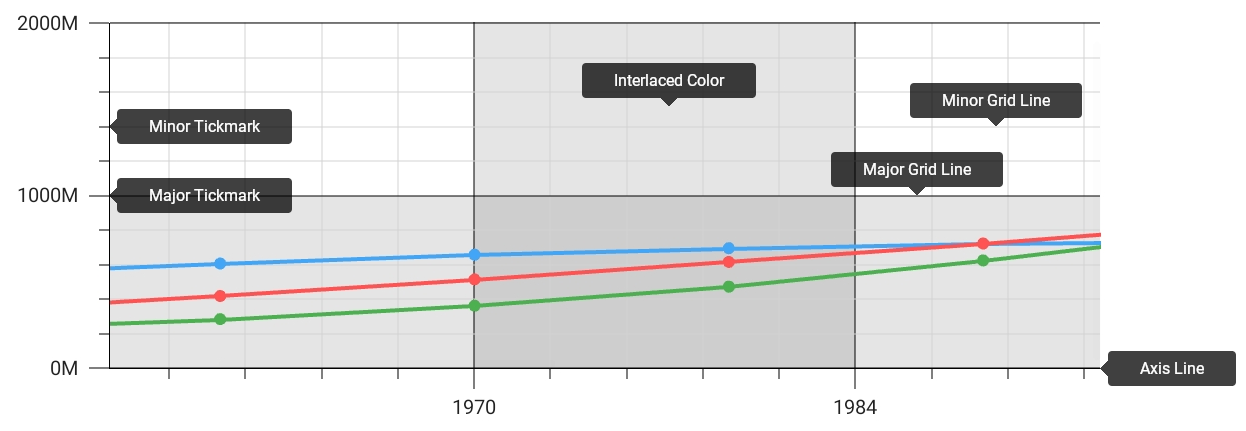
ChartView allows you to control the visibility and change the appearance of its x- and y-axis line, tickmarks and grid lines. You can also enable interlaced color intervals on the diagram’s surface. To customize these elements of an axis, create an AxisStyle object, specify its properties’ values, and assign this object to the axis’s Style property.
#Example
This example uses the AxisStyle class properties to customize axis lines, display grid lines and tickmarks with the specified appearance, and enable interlaced color intervals on the chart diagram.
<ContentPage xmlns="http://schemas.microsoft.com/dotnet/2021/maui"
             xmlns:x="http://schemas.microsoft.com/winfx/2009/xaml"
             x:Class="ChartAxesExample.MainPage"
             xmlns:dxc="clr-namespace:DevExpress.Maui.Charts;assembly=DevExpress.Maui.Charts">
  <ContentPage.Resources>
    <dxc:AxisStyle x:Key="axisStyle"
                   LineThickness="1" LineColor="Black"
                   MajorGridlinesVisible="True" MajorGridlinesThickness="1" MajorGridlinesColor="Black"
                   MinorGridLinesVisible="True" MinorGridlinesThickness="1" MinorGridlinesColor="LightGray"
                   MajorTickmarksVisible="True" MajorTickmarksThickness="1" MajorTickmarksLength="15"
                   MinorTickmarksVisible="True" MinorTickmarksThickness="1" MinorTickmarksLength="10"
                   InterlacedVisible="True" />
  </ContentPage.Resources>
  <dxc:ChartView>
    <!--...-->
    <dxc:ChartView.AxisX>
        <dxc:DateTimeAxisX Style="{StaticResource axisStyle}" />
    </dxc:ChartView.AxisX>
    <dxc:ChartView.AxisY>
        <dxc:NumericAxisY Style="{StaticResource axisStyle}"/>
    </dxc:ChartView.AxisY>
  </dxc:ChartView>
</ContentPage>