SeriesCollection Class
The collection of the ChartView‘s series.
Namespace: DevExpress.Maui.Charts
Assembly: DevExpress.Maui.Charts.dll
NuGet Package: DevExpress.Maui.Charts
Declaration
public class SeriesCollection :
    ChartCollection<Series>
Related API Members
The following members return SeriesCollection objects:
Remarks
To access and manage the collection of the chart’s series, use the ChartView.Series property. ChartView supports the following series types:
Chart | Series Type |
|---|---|
|
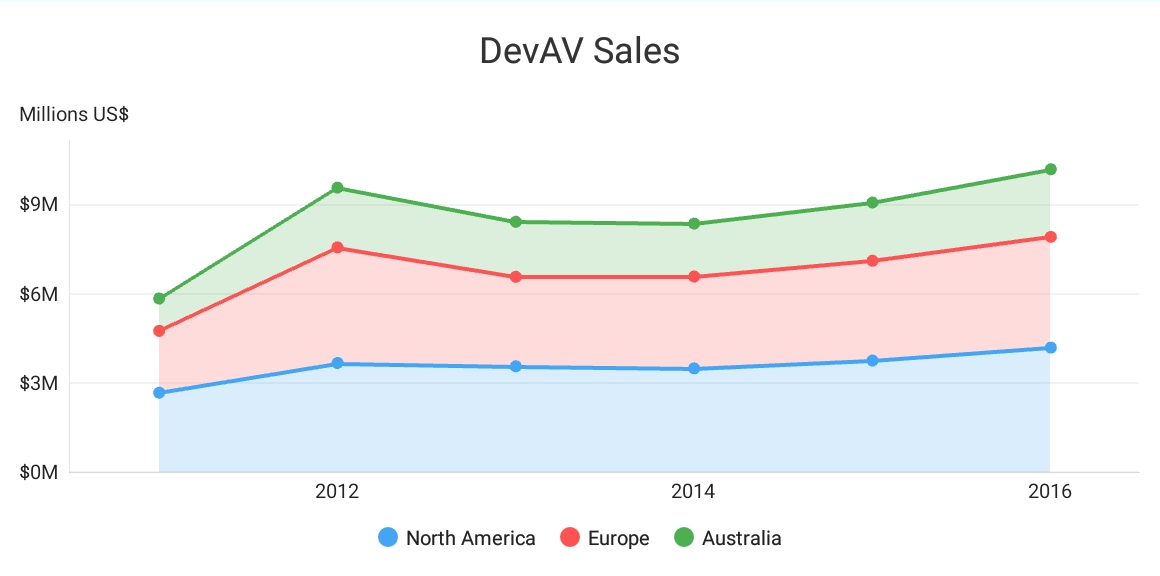
Displays data as filled areas on a chart, with each data point as a peak or hollow in this filled area. |
|
Displays data as areas on a chart, so that each data point value is aggregated with values of the underlying data points. |
|
Displays data as areas on a chart, so that each data point value is stacked with values of all the other corresponding data points and the total area is always the full area of the chart diagram. |
|
Displays data as filled areas on a chart, with data points connected by horizontal and vertical lines. |
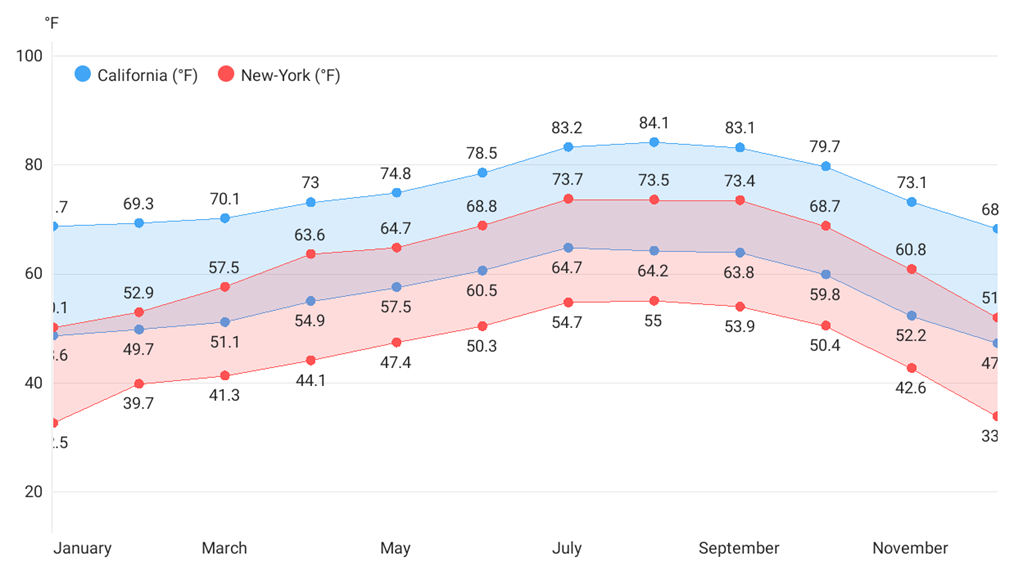
|
Displays data as a filled area between two value sets. |
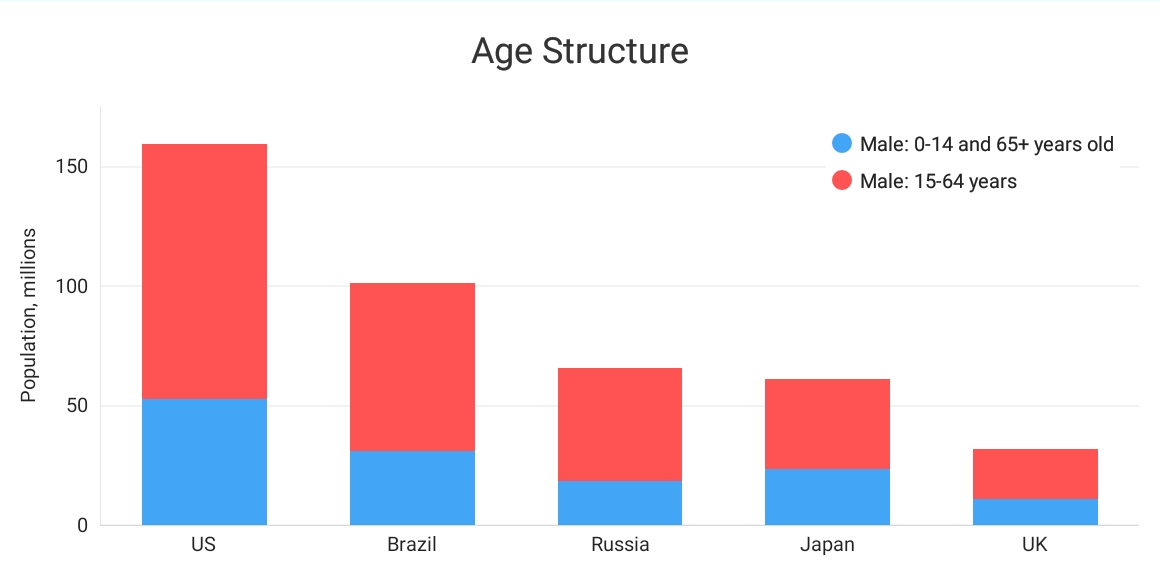
|
Displays data as individual bars grouped by arguments, and each bar height is determined by the data value. |
|
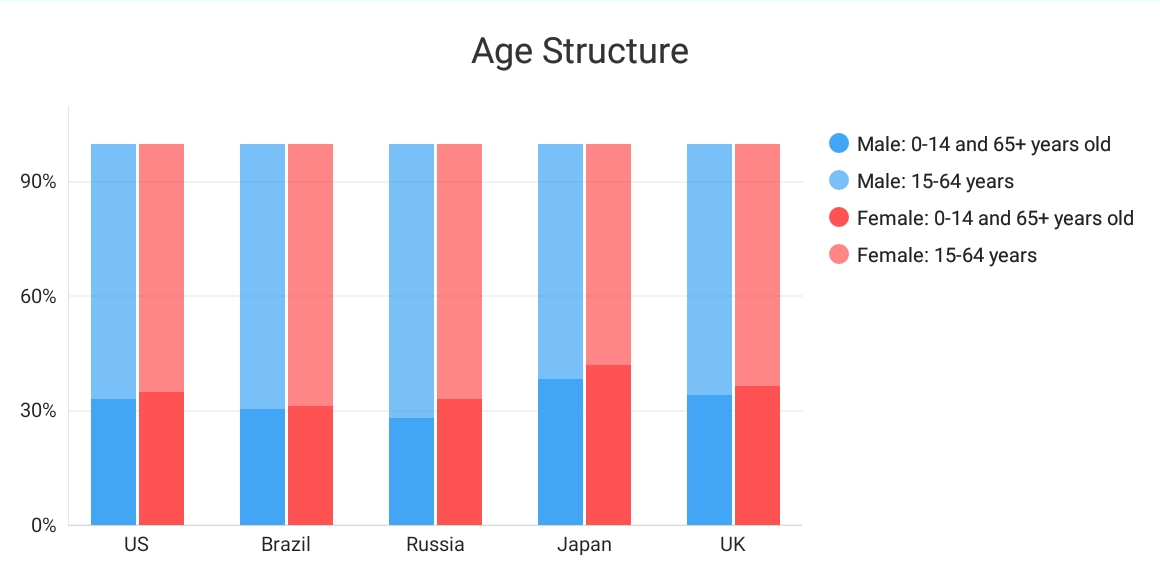
Displays data as bars stacked by arguments, so that each stacked bar height is determined by the total of all the series values for the argument. |
|
Displays data as bars stacked by arguments, so that each stacked bar height is always the full height of the chart diagram and series values are displayed as percentages of a bar. |
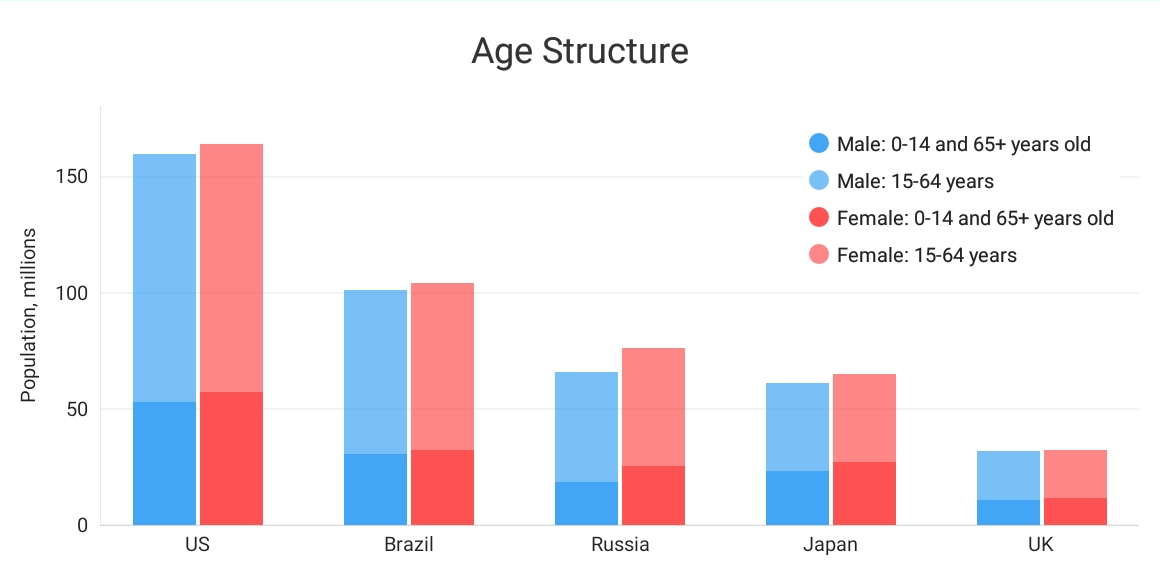
|
Displays data as bars stacked according to the StackedGroup property value and grouped by arguments. The height of each stacked bar is determined by the total of series values the bar contains. |
| SideBySideFullStackedBarSeries Displays data as bars stacked according to the StackedGroup property value and grouped by arguments. The height of each bar is always the full height of the chart diagram and series values are displayed as percentages of a bar. |
|
Displays data as bars that show ranges between two data values for argument values. Bars with the same argument from different series may overlap. |
|
Displays data as bars grouped by arguments. Each bar shows the range between two data values for the argument value. |
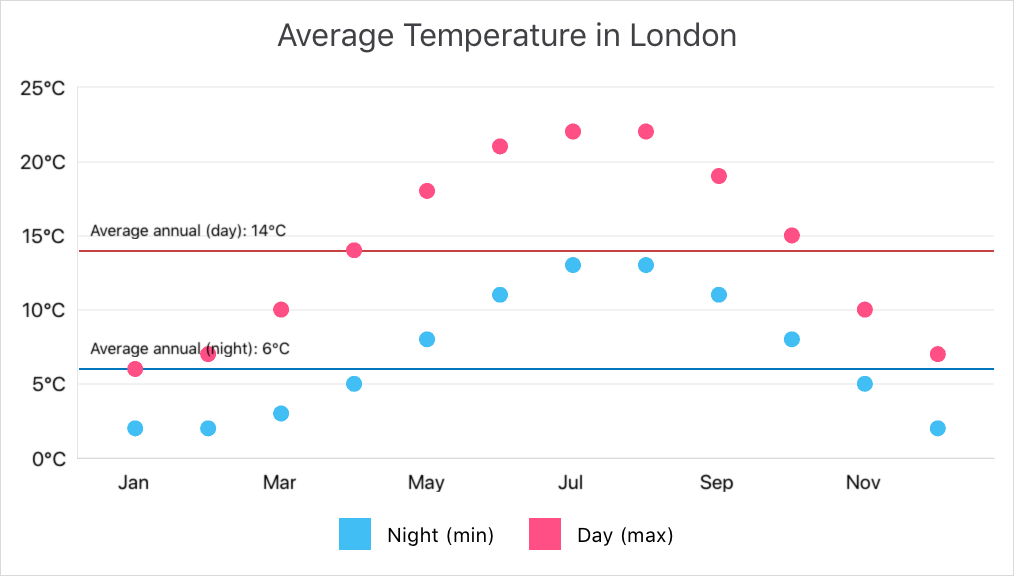
|
Displays data as a collection of points. |
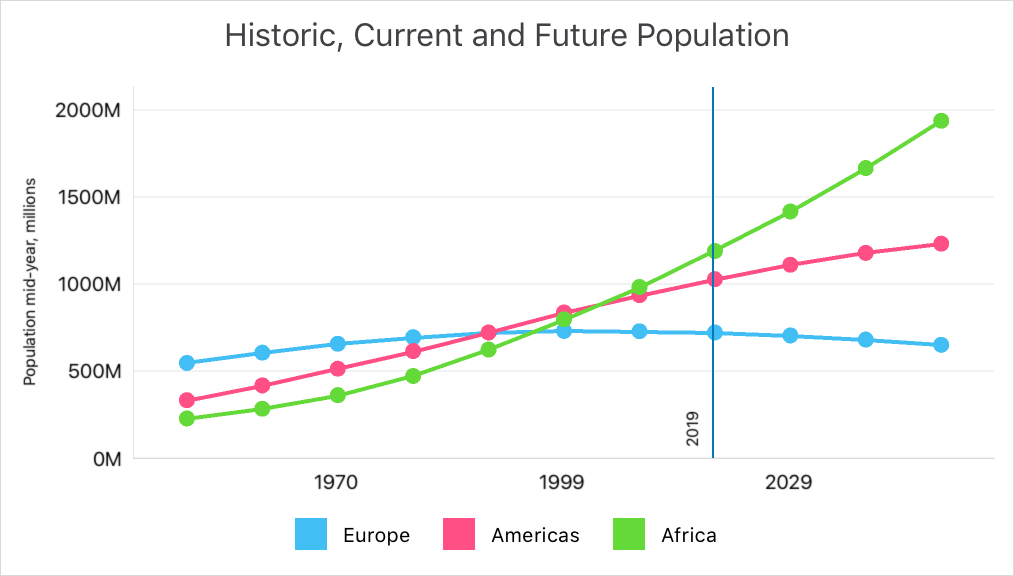
|
Displays data as points connected by a line. |
|
Displays data as points connected by a curved line. |
|
Displays data as points connected by horizontal and vertical lines. |
|
Displays data as a collection of points connected by a line, in the order they were indexed (opposite to LineSeries that automatically sorts all series points within the collection by their arguments). |
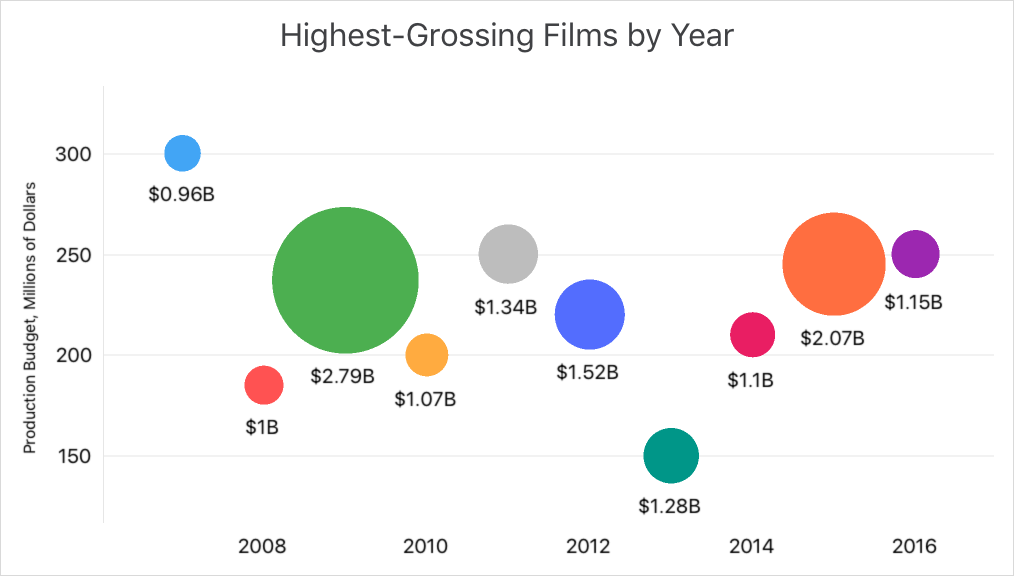
|
Displays three-dimensional data as a collection of bubbles, so that each bubble position visualizes the first two dimensions and the bubble size is the third dimension. |
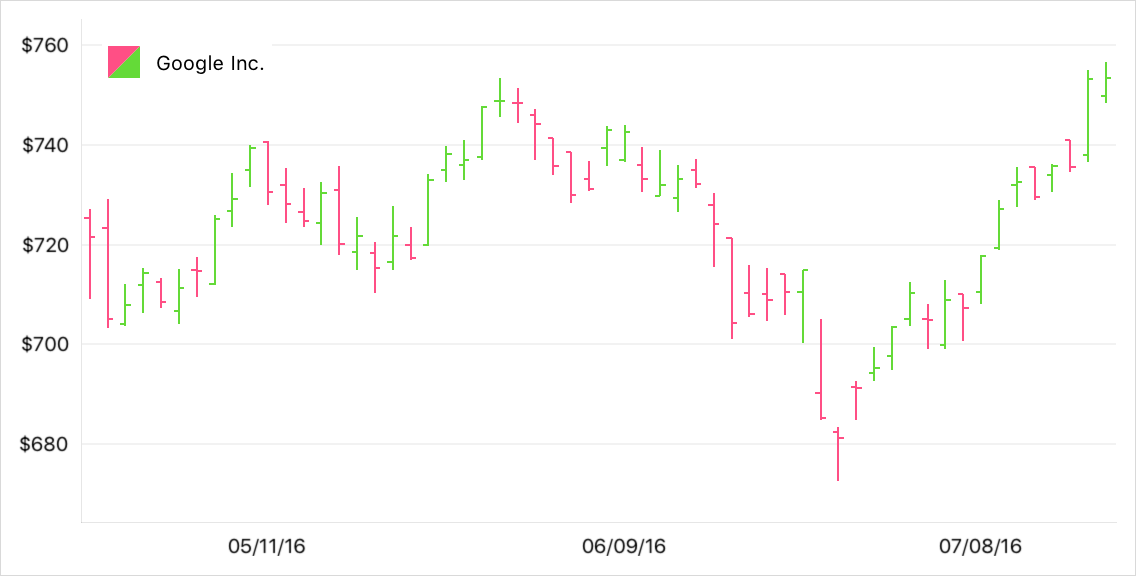
|
Displays an Open-High-Low-Close typical financial series so that each data point consists of a vertical line indicating the price range over one unit of time, and the left and right tick marks showing the opening and closing prices for that time period, respectively. |
|
Displays an Open-High-Low-Close typical financial series so that each data point consists of a vertical line indicating the price range over one unit of time and a rectangle showing the opening and closing prices for that time period. |