AxisStyle.MinorGridlinesThickness Property
Gets or sets the thickness of minor grid lines. This is a bindable property.
Namespace: DevExpress.Maui.Charts
Assembly: DevExpress.Maui.Charts.dll
NuGet Package: DevExpress.Maui.Charts
Declaration
public float MinorGridlinesThickness { get; set; }Property Value
| Type | Default | Description |
|---|---|---|
| Single | -1 | The grid line thickness, in scale-independent units. |
Remarks
Grid Lines (major and minor) are reference lines drawn across an axis from its tickmarks through the entire chart. Use the MinorGridlinesThickness property to specify the thickness of minor grid lines. To change the line color, use the MinorGridlinesColor property.
Note
Grid lines are hidden by default. Set the MinorGridLinesVisible property to DevExpress.Maui.Charts.DefaultBoolean.True to show minor grid lines on a chart diagram.
To show and customize major grid lines, use the MajorGridlinesVisible, MajorGridlinesThickness and MajorGridlinesColor properties.
Example
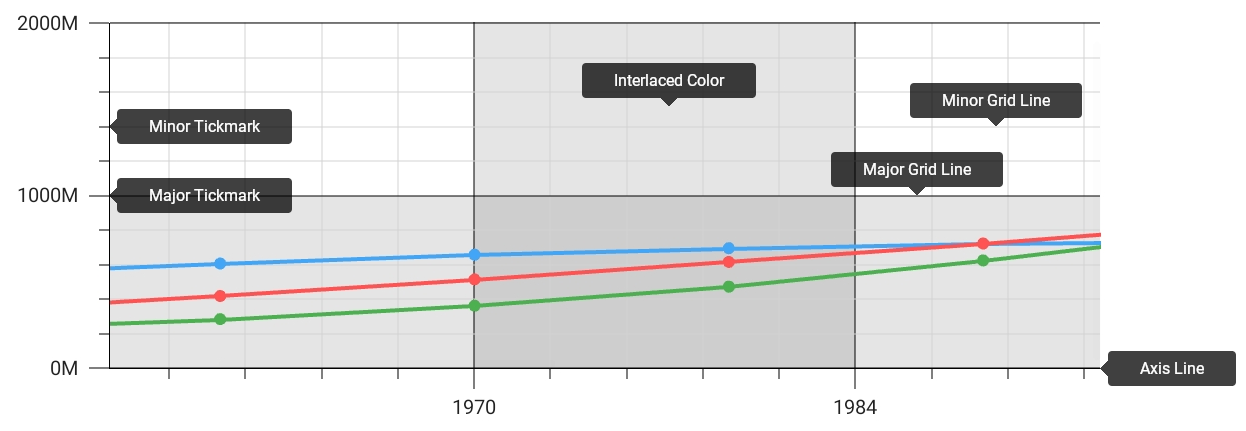
This example uses the AxisStyle class properties to customize axis lines, display grid lines and tickmarks with the specified appearance, and enable interlaced color intervals on the chart diagram.
<ContentPage xmlns="http://schemas.microsoft.com/dotnet/2021/maui"
             xmlns:x="http://schemas.microsoft.com/winfx/2009/xaml"
             x:Class="ChartAxesExample.MainPage"
             xmlns:dxc="clr-namespace:DevExpress.Maui.Charts;assembly=DevExpress.Maui.Charts">
  <ContentPage.Resources>
    <dxc:AxisStyle x:Key="axisStyle"
                   LineThickness="1" LineColor="Black"
                   MajorGridlinesVisible="True" MajorGridlinesThickness="1" MajorGridlinesColor="Black"
                   MinorGridLinesVisible="True" MinorGridlinesThickness="1" MinorGridlinesColor="LightGray"
                   MajorTickmarksVisible="True" MajorTickmarksThickness="1" MajorTickmarksLength="15"
                   MinorTickmarksVisible="True" MinorTickmarksThickness="1" MinorTickmarksLength="10"
                   InterlacedVisible="True" />
  </ContentPage.Resources>
  <dxc:ChartView>
    <!--...-->
    <dxc:ChartView.AxisX>
        <dxc:DateTimeAxisX Style="{StaticResource axisStyle}" />
    </dxc:ChartView.AxisX>
    <dxc:ChartView.AxisY>
        <dxc:NumericAxisY Style="{StaticResource axisStyle}"/>
    </dxc:ChartView.AxisY>
  </dxc:ChartView>
</ContentPage>