RegressionLineIndicator Class
A regression line indicator.
Namespace: DevExpress.Maui.Charts
Assembly: DevExpress.Maui.Charts.dll
NuGet Package: DevExpress.Maui.Charts
Declaration
public class RegressionLineIndicator :
    CalculatedSeries
Remarks
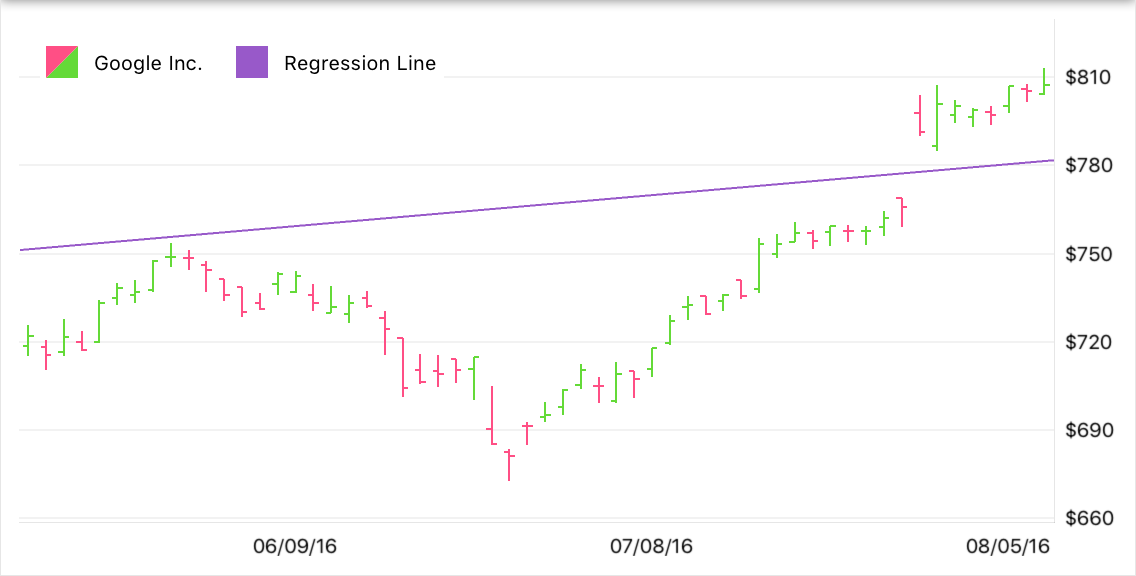
A regression line is a series indicator that allows you to perform linear regression analysis over your series data. The analysis aims to find a line that is as close to all points of a series as possible using the method of least squares to determine the line equation.
Add an Indicator to a Series
This example builds a regression line based on High values of a stock series.
- Add the
RegressionLineIndicatorobject to the chart’s collection of series (ChartView.Series). - Set the indicator’s Data property to a CalculatedSeriesDataAdapter class instance. Use this object’s Series property to specify a series for which the indicator should be calculated.
- Set the ValueLevel property to High to specify a point value used to build a regression line.
<dxc:ChartView x:Name="chart">
    <dxc:ChartView.Series>
        <dxc:StockSeries>
            <dxc:StockSeries.Data>
                <dxc:SeriesDataAdapter DataSource="{Binding StockPrices}" ArgumentDataMember="Date">
                    <dxc:ValueDataMember Type="High" Member="High" />
                    <dxc:ValueDataMember Type="Low" Member="Low" />
                    <dxc:ValueDataMember Type="Open" Member="Open" />
                    <dxc:ValueDataMember Type="Close" Member="Close" />
                </dxc:SeriesDataAdapter>
            </dxc:StockSeries.Data>
        </dxc:StockSeries>

        <dxc:RegressionLineIndicator ValueLevel="High"
                                     VisibleInLegend="True"
                                     DisplayName="Regression Line">
            <dxc:RegressionLineIndicator.Data>
                <dxc:CalculatedSeriesDataAdapter Series="{Binding Series[0], Source={x:Reference chart}}"/>
            </dxc:RegressionLineIndicator.Data>
        </dxc:RegressionLineIndicator>
    </dxc:ChartView.Series>
</dxc:ChartView>
Customize Indicator Appearance
To change the indicator line appearance, set the RegressionLineIndicator.Style property to the LineIndicatorStyle object with the specified Stroke and StrokeThickness properties.
<dxc:RegressionLineIndicator>
    <dxc:RegressionLineIndicator.Style>
        <dxc:LineIndicatorStyle Stroke="#9859c9"/>
    </dxc:RegressionLineIndicator.Style>

    <!--Indicator Data-->
</dxc:RegressionLineIndicator>
Inheritance
System.Object
BindableObject
Element
ChartElementBase
ChartSeriesElement
SeriesBase
Series
CalculatedSeries
RegressionLineIndicator
See Also