CandleStickSeries Class
Displays an Open-High-Low-Close typical financial series so that each data point consists of a vertical line indicating the price range over one unit of time and a rectangle showing the opening and closing prices for that time period.
Namespace: DevExpress.Maui.Charts
Assembly: DevExpress.Maui.Charts.dll
NuGet Package: DevExpress.Maui.Charts
Declaration
public class CandleStickSeries :
    FinancialSeries
Remarks
This view is used to visualize the stock market state for a particular time period.
A data point is green if the stock closes higher than its opening price. Otherwise, the point is red.

Series Data
To provide data for the candlestick series, set the CandleStickSeries.Data property to the SeriesDataAdapter class instance. Use the adapter’s properties to specify the data source for the series, and to define the data source members used to generate series points and labels. This series type requires 1 argument and 4 values (open, high, low, and close prices) for a data point.
You can also create a custom data adapter to populate the series with data. For example, it can be useful when data is generated on the fly and you don’t need to store it.
<ContentPage.BindingContext>
    <local:MainViewModel/>
</ContentPage.BindingContext>
<dxc:ChartView>
    <dxc:ChartView.Series>
        <dxc:CandleStickSeries>
            <dxc:CandleStickSeries.Data>
                <dxc:SeriesDataAdapter DataSource="{Binding StockPrices}" ArgumentDataMember="Date">
                    <dxc:ValueDataMember Type="High" Member="High" />
                    <dxc:ValueDataMember Type="Low" Member="Low" />
                    <dxc:ValueDataMember Type="Open" Member="Open" />
                    <dxc:ValueDataMember Type="Close" Member="Close" />
                </dxc:SeriesDataAdapter>
            </dxc:CandleStickSeries.Data>
        </dxc:CandleStickSeries>
    </dxc:ChartView.Series>
</dxc:ChartView>
Indicators
Technical indicators are special metrics used to analyze and process financial data visually.

Regression Line Indicator

Simple Moving Average and Envelope

Williams %R Indicator
You can add the following indicators to a candlestick series:
Indicators | Class |
|---|---|
Simple Indicators | |
Price Indicators | MedianPriceIndicator |
Moving Average and Envelope | MovingAverageIndicator |
Trend Indicators | BollingerBandsIndicator |
Oscillator Indicators | AverageTrueRangeIndicator |
Example
This example builds a Bollinger Bands indicator for Close prices of a candlestick series.
- Add the BollingerBandsIndicator object to the chart’s collection of series (ChartView.Series).
- Set the indicator’s Data property to a CalculatedSeriesDataAdapter class instance. Use this object’s Series property to specify a series for which the indicator should be calculated.
- Use the ValueLevel and PointsCount properties to specify the price level of a financial series point and the number of data points used to calculate the simple moving average and standard deviation.
- Use the StandardDeviationMultiplier property to specify the number of standard deviations that define the distance between the moving average (middle band) and the upper/lower band.
<dxc:ChartView x:Name="chart">
    <dxc:ChartView.Series>
        <dxc:CandleStickSeries>
            <dxc:CandleStickSeries.Data>
                <dxc:SeriesDataAdapter DataSource="{Binding StockPrices}" ArgumentDataMember="Date">
                    <dxc:ValueDataMember Type="High" Member="High" />
                    <dxc:ValueDataMember Type="Low" Member="Low" />
                    <dxc:ValueDataMember Type="Open" Member="Open" />
                    <dxc:ValueDataMember Type="Close" Member="Close" />
                </dxc:SeriesDataAdapter>
            </dxc:CandleStickSeries.Data>
        </dxc:CandleStickSeries>

        <dxc:BollingerBandsIndicator ValueLevel="Close"
                                     PointsCount="20"
                                     StandardDeviationMultiplier="2"
                                     DisplayName="Bollinger Bands 20">
            <dxc:BollingerBandsIndicator.Data>
                <dxc:CalculatedSeriesDataAdapter Series="{Binding Series[0], Source={x:Reference chart}}"/>
            </dxc:BollingerBandsIndicator.Data>
        </dxc:BollingerBandsIndicator>
    </dxc:ChartView.Series>
</dxc:ChartView>
Empty Ranges
When plotting stock prices, you can exclude ranges with no data from a date-time X-axis (for example, to avoid gaps on weekends when markets are closed). To do this, set the DateTimeAxisX.EmptyRangesVisible property to false (the default value is true).

Series Labels
You can accompany candlestick series’ data points with labels to show data point values as text on a chart:

To enable series labels, set the CandleStickSeries.Label property to the FinancialSeriesLabel object, and use this object’s properties to adjust the label settings:
TextPattern - Formats series label text.
A pattern includes regular text (which is displayed as is) and placeholder strings enclosed in braces. Placeholders define which values are shown in labels. You can use the following placeholders to specify the text pattern for candlestick series’ labels:Placeholder
Description
{S}
Displays a series name.
{A}
Displays a series point argument.
{O}
Displays a financial series point open value.
{H}
Displays a financial series point high value.
{L}
Displays a financial series point low value.
{C}
Displays a financial series point close value.
Note
To format these values, you can use default format strings after the
$sign.
For example, in the{C$#.##}string,Cis a placeholder,$is a format string separator, and#.##is a format string.- Position , Indent - Specify how a label is positioned relative to a series point.
- Style - Provides access to the SeriesLabelStyle object that stores label appearance settings (TextStyle).
- Visible - Allows you to show or hide labels for the series.
<dxc:CandleStickSeries>
    <dxc:CandleStickSeries.Label>
        <dxc:FinancialSeriesLabel TextPattern="{}{C$#.#}"
                                  Position="Top"
                                  Indent="15"/>
    </dxc:CandleStickSeries.Label>
</dxc:CandleStickSeries>
Legend
A legend (ChartBaseView.Legend) allows you to distinguish between series on a chart. A legend item includes a color marker and text that explains data the series shows.

The series’ LegendTextPattern property allows you to configure a string that the series provides for a legend item. The default text that a legend item shows is the series’ DisplayName.
<dxc:CandleStickSeries LegendTextPattern="Stocks: {S}">
    <!--...-->
</dxc:CandleStickSeries>
To exclude a particular series from the legend, set that series’ VisibleInLegend property to false.
Hints
ChartView can display hints (ChartView.Hint) as tooltips or as a crosshair cursor to show information about a tapped series or data point. A hint requests data to display from a series. Use the Series.HintOptions property to specify which data the series should return for a hint.
Tooltips
This example sets up the chart so that it shows a tooltip for a candlestick series point when a user taps it.

- Set the chart hint’s Behavior property to the TooltipHintBehavior class instance.
Set the series’ HintOptions property to the SeriesHintOptions object and use the PointTextPattern property to specify the tooltip text pattern.
When configuring financial series, you can use the following placeholders to specify text patterns for items of the crosshair label:Placeholder
Description
{S}
Displays a series name.
{A}
Displays a series point argument.
{O}
Displays a financial series point open value.
{H}
Displays a financial series point high value.
{L}
Displays a financial series point low value.
{C}
Displays a financial series point close value.
Note
To format these values, you can use default format strings after the
$sign.
For example, in the{C$#.##}string,Cis a placeholder,$is a format string separator, and#.##is a format string.
<dxc:ChartView>
<dxc:ChartView.Hint>
<dxc:Hint>
<dxc:Hint.Behavior>
<dxc:TooltipHintBehavior ShowPointTooltip="True" ShowSeriesTooltip="False"/>
</dxc:Hint.Behavior>
</dxc:Hint>
</dxc:ChartView.Hint>
<dxc:ChartView.Series>
<dxc:CandleStickSeries>
<dxc:CandleStickSeries.HintOptions>
<dxc:SeriesHintOptions
PointTextPattern="{}{S} High: ${H$###.##} Open: ${O$###.##} Low: ${L$###.##} Close: ${C$###.##}"/>
</dxc:CandleStickSeries.HintOptions>
<!--Series Data-->
</dxc:CandleStickSeries>
</dxc:ChartView.Series>
</dxc:ChartView>
Crosshair Cursor
This example sets up the chart so that it shows a hint for a candlestick series point as a crosshair cursor.

- Set the chart hint’s Behavior property to the CrosshairHintBehavior class instance.
Set the series’ HintOptions property to the SeriesCrosshairOptions object and specify this object’s properties:
- ShowInLabel - to specify whether the crosshair label should provide information for points of the current series.
PointTextPattern - to define the text pattern used to show information about the series point within a crosshair label.
When configuring financial series, you can use the following placeholders to specify text patterns for items of the crosshair label:Placeholder
Description
{S}
Displays a series name.
{A}
Displays a series point argument.
{O}
Displays a financial series point open value.
{H}
Displays a financial series point high value.
{L}
Displays a financial series point low value.
{C}
Displays a financial series point close value.
Note
To format these values, you can use default format strings after the
$sign.
For example, in the{C$#.##}string,Cis a placeholder,$is a format string separator, and#.##is a format string.- AxisLineVisible, AxisLabelVisible - to specify whether the crosshair cursor should display axis lines and labels for the series.
<dxc:ChartView>
<dxc:ChartView.Hint>
<dxc:Hint>
<dxc:Hint.Behavior>
<dxc:CrosshairHintBehavior GroupHeaderTextPattern="{}{A$MM/dd/yy}"
MaxSeriesCount="4"/>
</dxc:Hint.Behavior>
</dxc:Hint>
</dxc:ChartView.Hint>
<dxc:ChartView.Series>
<dxc:CandleStickSeries>
<dxc:CandleStickSeries.HintOptions>
<dxc:SeriesCrosshairOptions
PointTextPattern="{}{S} High: ${H$###.##} Open: ${O$###.##} Low: ${L$###.##} Close: ${C$###.##}"
ShowInLabel="True"
AxisLabelVisible="True"
AxisLineVisible="True"/>
</dxc:CandleStickSeries.HintOptions>
<!--Series Data-->
</dxc:CandleStickSeries>
</dxc:ChartView.Series>
</dxc:ChartView>
Note
A crosshair cursor also requests data to display from axes. Use the AxisBase.HintOptions property to specify how the hint interacts with the axis.
Series Appearance
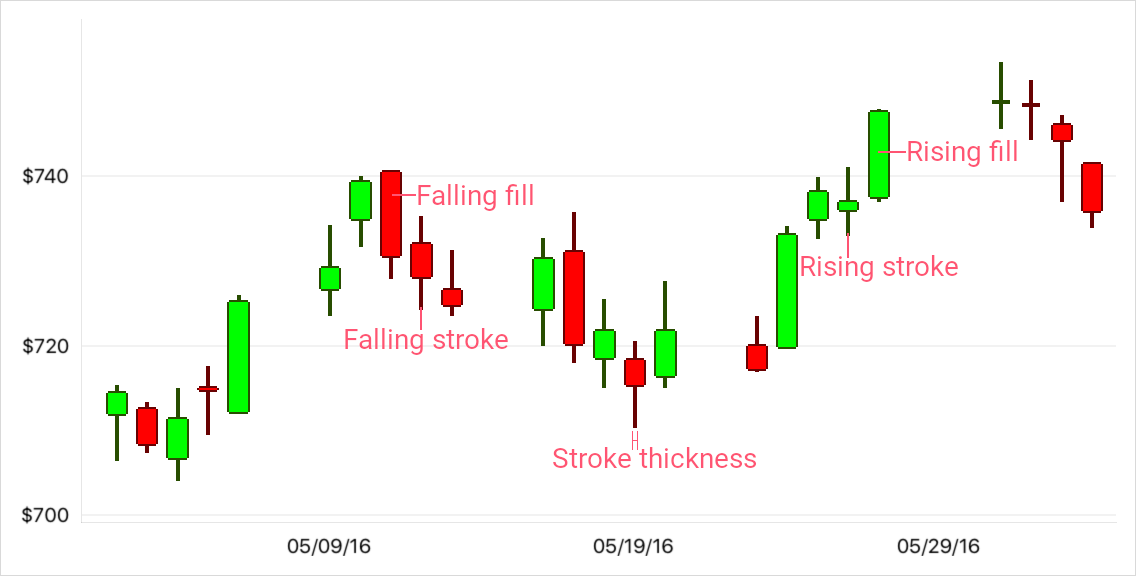
To change the candlestick series appearance, set the CandleStickSeries.Style property to the CandleStickSeriesStyle object, and use this object’s properties that specify colors (RisingStroke/RisingFill and FallingStroke/FallingFill) and thickness (StrokeThickness) of data point markers (candlesticks).
<dxc:CandleStickSeries>
    <dxc:CandleStickSeries.Style>
        <dxc:CandleStickSeriesStyle RisingStroke="#1f201e" RisingFill="#474946"
                                    FallingStroke="#e63833" FallingFill="#ff6c60"
                                    StrokeThickness="2"/>
    </dxc:CandleStickSeries.Style>
    <!--Series Data-->
</dxc:CandleStickSeries>