BarSeries.PointColorizer Property
Gets or sets a colorizer that specifies how to color-code bars. This is a bindable property.
Namespace: DevExpress.Maui.Charts
Assembly: DevExpress.Maui.Charts.dll
NuGet Package: DevExpress.Maui.Charts
Declaration
public IPointColorizer PointColorizer { get; set; }Property Value
| Type | Description |
|---|---|
| IPointColorizer | The colorizer object. |
Remarks
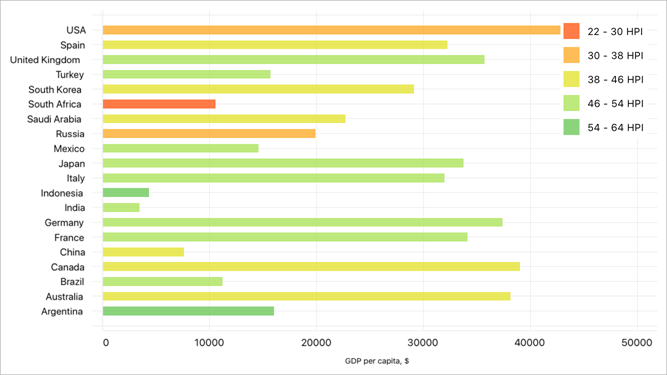
A point colorizer allows you to specify one or more conditions based on which a chart applies colors to series points (bars). For example, point colors indicate the Happy Planet Index (HPI for short) on the following chart:
You can use a predefined colorizer or implement a custom colorizer for series points.
Use a Predefined Colorizer
The ChartView ships with point and value range colorizers that use predefined algorithms to select point colors.
Point Colorizer
Assign a ColorEachPointColorizer object to the PointColorizer property of the series to access colors from the default or custom palette.
Value Range Colorizer
You can color series points based on their Y-axis values.
- Assign a ValueBandPointColorizer object to the
PointColorizerproperty of the series. - Populate the colorizer’s ColorStops collection with ColorStop objects. Each
ColorStopobject defines a value range (a pair of Y-axis values) and color. If a Y-axis value falls within the range, the point is painted with this color.
Implement a Custom Colorizer
Point Colorizer
The ChartView can color points of a series according to a custom algorithm based on point arguments/values and values of the chart’s bound data source.
Create a class that implements the ICustomPointColorizer or IIndexBasedCustomPointColorizer interface and assign this class instance to the PointColorizer property of the series.
Value Range Colorizer
A predefined value range colorizer colors points according to their Y-axis values. If you require a series point color to indicate a value of the specified data source field, implement a custom value range colorizer. To do this:
- Assign a CustomValueBandPointColorizer object to the
PointColorizerproperty of the series. - Create a class that implements the ICustomColorizerNumericValueProvider interface and its GetValueForColorizer method that returns a value from the data source based on which a series point should be colored. Assign this class value to the colorizer’s ValueProvider property.
- Populate the colorizer’s ColorStops collection with ColorStop objects. Each
ColorStopobject defines a value range and color. If a value that the GetValueForColorizer method returns for a series point falls within the range, the point is painted with this color.
Example
In this example, the bar chart displays cryptocurrency portfolio yield. It colors series points red when their Y-axis values are between -100 and 0, and green when values are between 0 and 100. Note that this chart diagram is rotated.
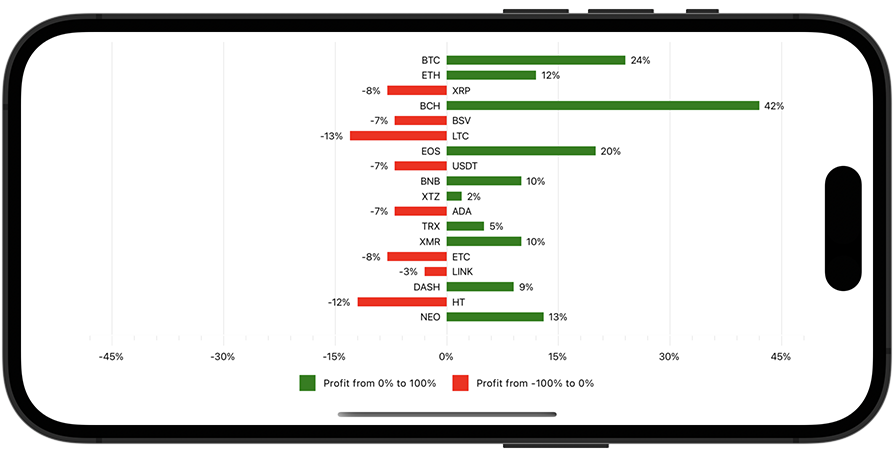
Create a data source – a list of objects each of which has the Ticker property that returns a string (point argument) and the Profit property that returns a number (point value).
using Microsoft.Maui.Graphics;
using System.Collections.Generic;

namespace ColorizerExample {
    public class ViewModel {
        public List<CryptocurrencyPortfolioItem> CryptocurrencyPortfolioData { get; }

        public ViewModel(){
            CryptocurrencyPortfolioData = new List<CryptocurrencyPortfolioItem>(){
                new CryptocurrencyPortfolioItem("NEO", 13),
                new CryptocurrencyPortfolioItem("HT", -12),
                new CryptocurrencyPortfolioItem("DASH", 9),
                new CryptocurrencyPortfolioItem("LINK", -3),
                new CryptocurrencyPortfolioItem("ETC", -8),
                new CryptocurrencyPortfolioItem("XMR", 10),
                new CryptocurrencyPortfolioItem("TRX", 5),
                new CryptocurrencyPortfolioItem("ADA", -7),
                new CryptocurrencyPortfolioItem("XTZ", 2),
                new CryptocurrencyPortfolioItem("BNB", 10),
                new CryptocurrencyPortfolioItem("USDT", -7),
                new CryptocurrencyPortfolioItem("EOS", 20),
                new CryptocurrencyPortfolioItem("LTC", -13),
                new CryptocurrencyPortfolioItem("BSV", -7),
                new CryptocurrencyPortfolioItem("BCH", 42),
                new CryptocurrencyPortfolioItem("XRP", -8),
                new CryptocurrencyPortfolioItem("ETH", 12),
                new CryptocurrencyPortfolioItem("BTC", 24),
            };
        }
    }

    public class CryptocurrencyPortfolioItem {
        public string Ticker { get; private set; }
        public double Profit { get; private set; }

        public CryptocurrencyPortfolioItem(string ticker, double profit) {
            Ticker = ticker;
            Profit = profit;
        }
    }
}
Assign a ValueBandPointColorizer object to the
BarSeries.PointColorizerproperty. Populate the colorizer’s ColorStops collection with two ColorStop objects that specify colors for ranges of point values.<ContentPage xmlns:x="http://schemas.microsoft.com/winfx/2009/xaml" xmlns:dxc="clr-namespace:DevExpress.Maui.Charts;assembly=DevExpress.Maui.Charts" x:Class="ColorizerExample.MainPage" xmlns:local="clr-namespace:ColorizerExample"> <ContentPage.BindingContext> <local:ViewModel/> </ContentPage.BindingContext> <dxc:ChartView x:Name="chart" Rotated="True"> <dxc:ChartView.Series> <dxc:BarSeries LegendTextPattern="{}Profit from {CLV}% to {CHV}%"> <!-- Bind the series to the data source. --> <dxc:BarSeries.Data> <dxc:SeriesDataAdapter DataSource="{Binding CryptocurrencyPortfolioData}" ArgumentDataMember="Ticker"> <dxc:ValueDataMember Type="Value" Member="Profit"/> </dxc:SeriesDataAdapter> </dxc:BarSeries.Data> <dxc:BarSeries.Label> <dxc:BarSeriesLabel Position="Outside" Behavior="Cut" TextPattern="{}{V}%"/> </dxc:BarSeries.Label> <dxc:BarSeries.PointColorizer> <dxc:ValueBandPointColorizer> <dxc:ValueBandPointColorizer.ColorStops> <dxc:ColorStop Color="Green" Value1="0" Value2="100"/> <dxc:ColorStop Color="Red" Value1="0" Value2="-100"/> </dxc:ValueBandPointColorizer.ColorStops> </dxc:ValueBandPointColorizer> </dxc:BarSeries.PointColorizer> </dxc:BarSeries> </dxc:ChartView.Series> <!-- Specify axis and legend settings here. --> </dxc:ChartView> </ContentPage>