SeriesBase Class
A base class for the SeriesTemplate and Series classes.
Namespace: DevExpress.XtraCharts
Assembly: DevExpress.XtraCharts.v25.2.dll
NuGet Package: DevExpress.Charts
Declaration
public class SeriesBase :
    ChartElement,
    ISeriesBase,
    ISeriesDataAdapter,
    ISeriesPointFactory,
    IHitTest,
    IXtraSupportCreateContentPropertyValue,
    IXtraSupportDeserializeCollectionItem,
    ITopNOptions,
    IPointsFilterOptions,
    ICheckableLegendItem,
    ILegendItem,
    IFilteredComponent,
    IFilteredComponentBase,
    IFilteringUIClient,
    IFilterCriteriaBindingAware,
    IFilterCriteriaProvider,
    ISeriesProvider,
ISummaryOptionsOwnerRelated API Members
The following members return SeriesBase objects:
Remarks
The SeriesBase class contains the core functionality of the series objects. Use the ChartControl.SeriesTemplate property to access these settings if you bind a Chart Control to a data source. When you add series manually, Series objects contain inherited API members from the SeriesBase class.
The table below lists the main API members:
Member | Description |
|---|---|
Contains the series view settings. | |
Changes the series view type. | |
Gets or sets the data field name that contains series point arguments. | |
Gets a collection of data field names that contain series point values. | |
Specify the scale type for axes. | |
Filter the series data. | |
Defines series label settings. | |
SeriesBase.SeriesPointsSorting, SeriesBase.SeriesPointsSortingKey | Specify sort settings. |
Specifies whether the chart shows the series in a legend. | |
Defines whether the series is visible. |
Example
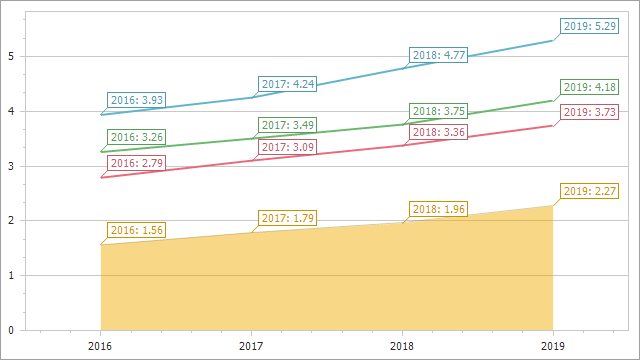
This example simultaneously configures settings for template series and a series added to the chart manually.

Follow the steps below to implement this scenario:
Create a Windows Forms Application in Visual Studio, and add all required assemblies to the References list of your project.
Create a chart in the Form1_Load event handler.
Populate the chart with autogenerated series:
Use the ChartControl.DataSource property to bind the chart to a data source. The custom GetSeriesTemplateData method returns the chart’s data in this example.
Use the ChartControl.SeriesDataMember property to specify the data field that contains series names.
Set the ChartControl.SeriesTemplate.View property to LineSeriesView to generate line series.
Call the custom ConfigureSeries method with the ChartControl.SeriesTemplate object passed as a parameter to specify the following settings for all template series: ArgumentDataMember, ValueDataMembers, ArgumentScaleType, ValueScaleType, LabelsVisibility, and Label.TextPattern.
Add a single series:
Call the Series(String, ViewType) constructor to create a series. Pass the series name and series type as parameters to this method.
Use the Series.DataSource property to bind the series to a data source. The custom GetSeriesData method returns the series data.
Add the series to the ChartControl.Series collection.
Call the custom ConfigureSeries method with the series passed as a parameter to specify series settings.
Use the ChartControl.Dock property to specify the chart position. Call the Controls.Add method to add the chart to the form.
using DevExpress.XtraCharts;
using System;
using System.Data;
using System.Windows.Forms;
using DevExpress.Utils;

namespace series_base_example {
    public partial class Form1 : Form {
        public Form1() {
            InitializeComponent();
        }

        private void Form1_Load(object sender, EventArgs e) {
            ChartControl chart = new ChartControl();
            // Hide the legend.
            chart.Legend.Visibility = DefaultBoolean.False;

            // Define the series template for multiple series.
            chart.DataSource = GetSeriesTemplateData();
            chart.SeriesDataMember = "Region";
            chart.SeriesTemplate.View = new LineSeriesView();

            ConfigureSeries(chart.SeriesTemplate);

            // Add a single series.
            Series series = new Series("Australia", ViewType.Area);
            series.DataSource = GetSeriesData();
            chart.Series.Add(series);

            ConfigureSeries(series);

            chart.Dock = DockStyle.Fill;
            this.Controls.Add(chart);
        }

        private void ConfigureSeries(SeriesBase series) {
            series.ArgumentDataMember = "Year";
            series.ValueDataMembers.AddRange(new string[] { "Sales" });
            series.ArgumentScaleType= ScaleType.Qualitative;
            series.ValueScaleType= ScaleType.Numerical;
            series.LabelsVisibility = DefaultBoolean.True;
            series.Label.TextPattern = "{A}: {V:F2}";
        }

        internal static DataTable GetSeriesTemplateData() {
            DataTable table = new DataTable();
            table.Columns.AddRange(new DataColumn[] { new DataColumn("Region", typeof(string)),
                                                      new DataColumn("Year", typeof(int)),
                                                      new DataColumn("Sales", typeof(decimal)) });
            table.Rows.Add("Asia", 2016, 3.9341D);
            table.Rows.Add("Asia", 2017, 4.2372D);
            table.Rows.Add("Asia", 2018, 4.7685D);
            table.Rows.Add("Asia", 2019, 5.2890D);

            table.Rows.Add("Europe", 2016, 2.7891D);
            table.Rows.Add("Europe", 2017, 3.0884D);
            table.Rows.Add("Europe", 2018, 3.3579D);
            table.Rows.Add("Europe", 2019, 3.7257D);

            table.Rows.Add("North America", 2016, 3.2566D);
            table.Rows.Add("North America", 2017, 3.4855D);
            table.Rows.Add("North America", 2018, 3.7477D);
            table.Rows.Add("North America", 2019, 4.1825D);

            return table;
        }

        internal static DataTable GetSeriesData() {
            DataTable table = new DataTable();
            table.Columns.AddRange(new DataColumn[] { new DataColumn("Region", typeof(string)),
                                                      new DataColumn("Year", typeof(int)),
                                                      new DataColumn("Sales", typeof(decimal)) });
            table.Rows.Add("Australia", 2016, 1.5632D);
            table.Rows.Add("Australia", 2017, 1.7871D);
            table.Rows.Add("Australia", 2018, 1.9576D);
            table.Rows.Add("Australia", 2019, 2.2727D);

            return table;
        }
    }
}