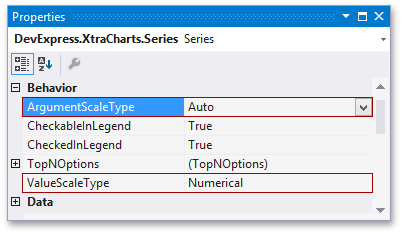
SeriesBase.ValueScaleType Property
Gets or sets a value that specifies the scale type for the value data of the series’ data points.
Namespace: DevExpress.XtraCharts
Assembly: DevExpress.XtraCharts.v26.1.dll
Declaration
[XtraChartsLocalizableCategory(XtraChartsCategory.Behavior)]
public ScaleType ValueScaleType { get; set; }Property Value
| Type | Description |
|---|---|
| ScaleType | A ScaleType enumeration value. |
Available values:
| Name | Description |
|---|---|
| Qualitative | Identifies the Qualitative data scale. This means that data provided for the Series.Points will be treated as qualitative values and will be shown on the axis as textual representations (e.g., A, B, and C). |
| Numerical | Identifies the Numerical data scale. This means that data provided for the Series.Points will be treated as numerical values and will be shown on the axis as numbers (e.g., 100, 200, and 300). |
| DateTime | Identifies the DateTime data scale. This means that data provided for the Series.Points will be treated as DateTime values and will be shown on the axis as DateTime values (e.g., January, 2003, January, 2004, and January, 2005). Note that in this case the |
| TimeSpan | Identifies the TimeSpan data scale. The data that you provide for the Series.Points will be treated and shown on the axis as TimeSpan values (for example, 00:00:00, 00:00:01, 00:00:02). Note that in this case, the axis’s TimeSpanScaleOptions property allows you to specify the scale-related settings. To define the output format of TimeSpan values shown on the axis, use the AxisBase.Label‘s TextPattern property. |
| Auto | The scale type is automatically determined according to the real type of underlying data. |
Remarks
A ValueScaleType property determines the parameters of the AxisYBase derived axis used to plot the given series. For example, the label format for the axis is specified using the AxisLabel.TextPattern property.
Note
A ScaleType.Qualitative value is not permitted. A ScaleType.DateTime is inapplicable if the current view does not support date-time values.
For more information, refer to Axis Scale Types.
Example
This example demonstrates how an axis’ date-time and numeric options can be customized, depending on the ScaleType defined for a series’ arguments and values.
using System;
using System.Windows.Forms;
using DevExpress.XtraCharts;
// ...

namespace FormatAxisLabels {
    public partial class Form1 : Form {
        public Form1() {
            InitializeComponent();
        }

        private void Form1_Load(object sender, EventArgs e) {
            // Create an empty chart.
            ChartControl chartControl1 = new ChartControl();

            // Create a bar series and add points to it.
            Series series1 = new Series("Series 1", ViewType.Bar);
            series1.Points.Add(new SeriesPoint(new DateTime(2009, 1, 1), new double[] { 26.25 }));
            series1.Points.Add(new SeriesPoint(new DateTime(2009, 2, 1), new double[] { 16.52 }));
            series1.Points.Add(new SeriesPoint(new DateTime(2009, 3, 1), new double[] { 22.21 }));
            series1.Points.Add(new SeriesPoint(new DateTime(2009, 4, 1), new double[] { 15.35 }));
            series1.Points.Add(new SeriesPoint(new DateTime(2009, 5, 1), new double[] { 24.15 }));

            // Add the series to the chart.
            chartControl1.Series.Add(series1);

            // Hide the legend (if necessary).
            chartControl1.Legend.Visibility = DevExpress.Utils.DefaultBoolean.False;

            // Set the scale type for the series' arguments and values.
            series1.ArgumentScaleType = ScaleType.DateTime;
            series1.ValueScaleType = ScaleType.Numerical;

            // Cast the chart's diagram to the XYDiagram type, to access its axes.
            XYDiagram diagram = chartControl1.Diagram as XYDiagram;

            // Define the date-time measurement unit, to which the beginning of
            // a diagram's gridlines and labels should be aligned.
            diagram.AxisX.DateTimeScaleOptions.GridAlignment = DateTimeGridAlignment.Day;

            // Define the detail level for date-time values.
            diagram.AxisX.DateTimeScaleOptions.MeasureUnit = DateTimeMeasureUnit.Month;

            // Define the custom date-time format (name of a month) for the axis labels.
            diagram.AxisX.Label.TextPattern = "{V:MMMM}";

            // Since the ValueScaleType of the chart's series is Numerical,
            // it is possible to customize the NumericOptions of Y-axis.
            diagram.AxisY.Label.TextPattern = "{V:C1}";

            // Add a title to the chart (if necessary).
            ChartTitle chartTitle1 = new ChartTitle();
            chartTitle1.Text = "Axis Scale Types";
            chartControl1.Titles.Add(chartTitle1);

            // Add the chart to the form.
            chartControl1.Dock = DockStyle.Fill;
            this.Controls.Add(chartControl1);
        }

    }
}
Related GitHub Examples
The following code snippets (auto-collected from DevExpress Examples) contain references to the ValueScaleType property.
Note
The algorithm used to collect these code examples remains a work in progress. Accordingly, the links and snippets below may produce inaccurate results. If you encounter an issue with code examples below, please use the feedback form on this page to report the issue.