WaterfallAbsoluteValueOptions Class
Stores settings for a waterfall chart that displays absolute data values.
Namespace: DevExpress.XtraCharts
Assembly: DevExpress.XtraCharts.v25.2.dll
NuGet Package: DevExpress.Charts
Declaration
Remarks
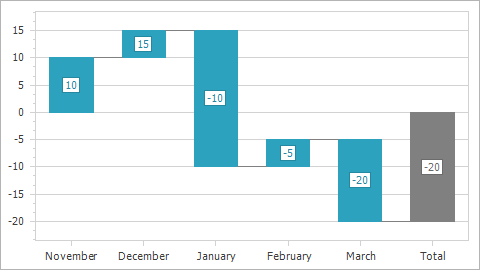
Use the WaterfallAbsoluteValueOptions when the chart data source stores absolute values. In this case, the chart control automatically calculates differences between neighbor data point values and displays them as rising and falling bars.
Example
This example shows how to create a waterfall chart based on a set of absolute data values.

- Add a series to a chart.
- Specify the series data members.
- Set the series’s ArgumentScaleType property to ScaleType.Qualitative.
- Use the WaterfallSeriesView object to configure the series view options.
- Specify value options. Use the
WaterfallAbsoluteValueOptionsclass if the data source stores absolute data values. If data source stores value differences, use the WaterfallRelativeValueOptions.
using DevExpress.XtraCharts;
using DevExpress.XtraEditors;
using System;
using System.Collections.Generic;

namespace WaterfallChart {
    public partial class Form1 : XtraForm {
        public Form1() {
            InitializeComponent();
        }
        private void Form1_Load(object sender, EventArgs e) {
            Series series = new Series("Series", ViewType.Waterfall);
            series.DataSource = DataPoint.GetDataPoints();
            series.ArgumentDataMember = "Argument";
            series.ValueDataMembers.AddRange(new string[] { "Value" });
            series.ArgumentScaleType = ScaleType.Qualitative;
            chartControl1.Series.Add(series);
            series.LabelsVisibility = DevExpress.Utils.DefaultBoolean.True;
            WaterfallSeriesView view = series.View as WaterfallSeriesView;
            if (view != null) {
                view.ValueOptions = new WaterfallAbsoluteValueOptions { ShowTotal = true };
            }
        }
    }
    public class DataPoint {
        public string Argument { get; set; }
        public double Value { get; set; }
        public DataPoint(string argument, double value) {
            this.Argument = argument;
            this.Value = value;
        }
        public static List<DataPoint> GetDataPoints() {
            List<DataPoint> data = new List<DataPoint> {
                new DataPoint("November", 10),
                new DataPoint("December", 15),
                new DataPoint("January", -10),
                new DataPoint("February", -5),
                new DataPoint("March", -20)
            };
            return data;
        }
    }
}
Implements
Inheritance
Object
ChartElement
WaterfallValueOptionsBase
WaterfallAbsoluteValueOptions
See Also