ChartCalculatedFieldCollection Class
A collection that stores calculated fields.
Namespace: DevExpress.XtraCharts
Assembly: DevExpress.XtraCharts.v26.1.dll
Declaration
public class ChartCalculatedFieldCollection :
    ChartElementNamedCollection,
    IEnumerable<ICalculatedField>,
IEnumerableRelated API Members
The following members return ChartCalculatedFieldCollection objects:
| Library | Related API Members |
|---|---|
| WinForms Controls | ChartControl.CalculatedFields |
| ASP.NET MVC Extensions | ChartControlSettings.CalculatedFields |
| ASP.NET Web Forms Controls | WebChartControl.CalculatedFields |
Remarks
The ChartCalculatedFieldCollection is a collection of the ChartCalculatedField objects.
Example
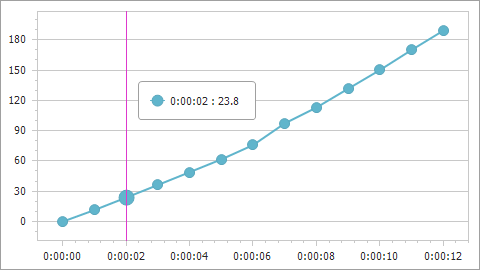
The following example shows how to create a calculated field and then use this field as a data source for a series. The field’s values are calculated by the following expression: [Time.Seconds] * [Velocity].
using DevExpress.XtraCharts;
using System;
using System.Collections.Generic;
using System.Windows.Forms;

namespace CalculatedFieldExample {
    public partial class Form1 : Form {
        //...
        private void Form1_Load(object sender, EventArgs e) {
            chartControl1.DataSource = GetDataPoints();

            ChartCalculatedField calcField = new ChartCalculatedField();
            calcField.Expression = "[Time.Seconds] * [Velocity]";
            calcField.FieldType = ChartCalculatedFieldType.Double;
            calcField.Name = "Displacement";
            chartControl1.CalculatedFields.Add(calcField);

            Series series = new Series("series", ViewType.Line);
            series.ArgumentDataMember = "Time";
            series.ValueDataMembers.AddRange("Displacement");
            chartControl1.Series.Add(series);
            XYDiagram diagram = chartControl1.Diagram as XYDiagram;
            diagram.AxisX.TimeSpanScaleOptions.MeasureUnit = TimeSpanMeasureUnit.Second;
            diagram.AxisY.WholeRange.AlwaysShowZeroLevel = false;
        }
        public List<DataPoint> GetDataPoints() {
            List<DataPoint> dataPoints = new List<DataPoint>() {
                new DataPoint (new TimeSpan(0, 0, 0), 10),
                new DataPoint (new TimeSpan(0, 0, 1), 11.46),
                new DataPoint (new TimeSpan(0, 0, 2), 11.90),
                //...
                // Other data points here.
                // ...
                new DataPoint (new TimeSpan(0, 0, 12), 15.756)
            };
            return dataPoints;
        }
    }
    public class DataPoint {
        public TimeSpan Time { get; set; }
        public double Velocity { get; set; }
        public DataPoint(TimeSpan time, double velocity) {
            this.Time = time;
            this.Velocity = velocity;
        }
    }
}
Inheritance
Object
CollectionBase
ChartCollectionBase
ChartElementNamedCollection
ChartCalculatedFieldCollection
See Also