ChartImageSizeMode Enum
Lists the values used to specify the mode for an image size.
Namespace: DevExpress.XtraCharts
Assembly: DevExpress.XtraCharts.v26.1.dll
Declaration
[ResourceFinder(typeof(XtraChartsResFinder), "PropertyNamesRes")]
public enum ChartImageSizeModeMembers
| Name | Description |
|---|---|
AutoSize
|
Represents the size mode, in which an image is auto-resized to fit its container’s bounds. |
Stretch
|
Represents the size mode, in which an image is stretched to fit its container’s bounds. |
Zoom
|
Represents the size mode, in which an image is zoomed to fit its container’s bounds. |
Tile
|
Represents the size mode, in which an image is tiled to fit its container’s bounds. |
Related API Members
The following properties accept/return ChartImageSizeMode values:
| Library | Related API Members |
|---|---|
| Cross-Platform Class Library | CrosshairLabelElement.MarkerImageSizeMode |
| CustomDrawSeriesEventArgs.LegendCheckBoxImageSizeMode | |
| CustomDrawSeriesEventArgsBase.LegendMarkerImageSizeMode | |
| CustomLegendItem.MarkerImageSizeMode | |
| ImageAnnotation.SizeMode | |
| WinForms Controls | CustomLegendItemModel.MarkerImageSizeMode |
| ImageAnnotationModel.SizeMode |
Remarks
The values listed by the ChartImageSizeMode enumeration are used to set the CustomDrawSeriesEventArgs.LegendCheckBoxImageSizeMode and ImageAnnotation.SizeMode properties.
Example
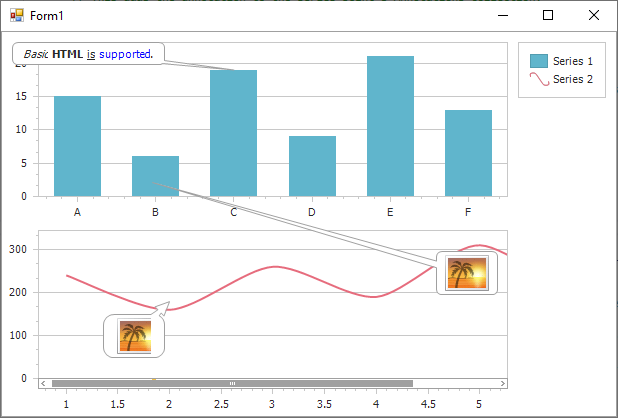
The following example demonstrates how to create text and image annotations and anchor them to a chart, its pane, and a series point.
#region #usings
using System;
using System.Drawing;
using System.IO;
using System.Windows.Forms;
using DevExpress.Drawing;
using DevExpress.XtraCharts;
// ...
#endregion #usings

namespace AnnotationsSample {
    public partial class Form1 : Form {
        public Form1() {
            InitializeComponent();
        }

        #region #generalcode
        private void Form1_Load(object sender, EventArgs e) {
            // Add a text annotation to the chart control's repository.
            chartControl1.AnnotationRepository.Add(new TextAnnotation("Annotation 1"));

            // And, assign a series point to the annotation's AnchorPoint property.
            // This adds the annotation to the series point's Annotations collection.
            chartControl1.AnnotationRepository[0].AnchorPoint =
                new SeriesPointAnchorPoint(chartControl1.Series[0].Points[2]);

            // Now, create an image annotation, and add it to the chart's collection.
            chartControl1.Annotations.AddImageAnnotation("Annotation 2",
                DXImage.FromStream(new FileStream(@"...\...\image.png", FileMode.Open, FileAccess.Read, FileShare.Read)));

            // Define the X and Y absolute coordinates for the annotation, in pixels.
            ((ChartAnchorPoint)chartControl1.Annotations[0].AnchorPoint).X = 150;
            ((ChartAnchorPoint)chartControl1.Annotations[0].AnchorPoint).Y = 150;

            // Obtain the additional pane from the diagram's collection.
            XYDiagramPaneBase myPane = ((XYDiagram)chartControl1.Diagram).Panes[0];

            // And, position the chart's annotation in this pane's right top corner;
            ((FreePosition)chartControl1.Annotations[0].ShapePosition).DockTarget = myPane;
            ((FreePosition)chartControl1.Annotations[0].ShapePosition).DockCorner = DockCorner.RightTop;

            // Another annotation is now being added to the collection of this pane.
            myPane.Annotations.AddImageAnnotation("Annotation 3",
                DXImage.FromStream(new FileStream(@"...\...\image.png", FileMode.Open, FileAccess.Read, FileShare.Read)));

            // Define its axis coordinates (in units appropriate for the scale type of the axes).
            ((PaneAnchorPoint)myPane.Annotations[0].AnchorPoint).AxisXCoordinate.AxisValue = 2;
            ((PaneAnchorPoint)myPane.Annotations[0].AnchorPoint).AxisYCoordinate.AxisValue = 180;

            // Position the annotation in relation to its anchor point.
            ((RelativePosition)myPane.Annotations[0].ShapePosition).Angle = -135;
            ((RelativePosition)myPane.Annotations[0].ShapePosition).ConnectorLength = 50;

            // You can get an annotation either via the collection of the element to which it is anchored,
            // or centrally, via the chart control's repository (e.g. by its name).
            TextAnnotation myTextAnnotation =
                (TextAnnotation)chartControl1.AnnotationRepository.GetElementByName("Annotation 1");
            ImageAnnotation myImageAnnotation =
                (ImageAnnotation)chartControl1.AnnotationRepository.GetElementByName("Annotation 3");

            // Define the text for the text annotation.
            myTextAnnotation.Text = "<i>Basic</i> <b>HTML</b> <u>is</u> <color=blue>supported</color>.";

            // Enable the interactive positioning for the image annotation.
            myImageAnnotation.RuntimeMoving = true;
            myImageAnnotation.RuntimeAnchoring = true;
            myImageAnnotation.RuntimeResizing = true;
            myImageAnnotation.RuntimeRotation = true;

            // Specify image annotation size mode.
            myImageAnnotation.SizeMode = ChartImageSizeMode.Tile;

            // And, adjust image annotation appearance options.
            myImageAnnotation.ShapeKind = ShapeKind.RoundedRectangle;
            myImageAnnotation.ShapeFillet = 10;
            myImageAnnotation.ConnectorStyle = AnnotationConnectorStyle.Arrow;
        }
        #endregion #generalcode

    }
}