Line Diagram
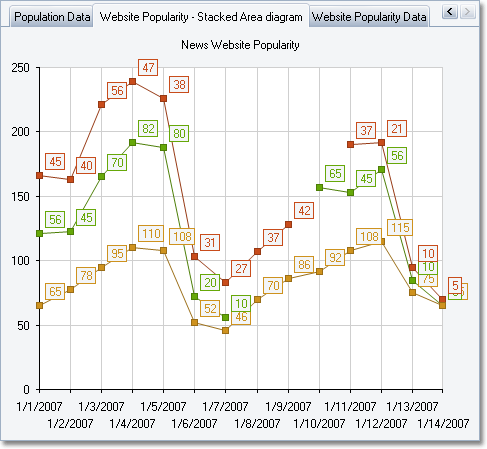
A line diagram connects neighboring value points with lines to display a trend in chart values. In line diagrams, a data marker consists of a value point and a line that connects this value point with the previous.
A line diagram connects neighboring value points with lines to display a trend in chart values. In line diagrams, a data marker consists of a value point and a line that connects this value point with the previous.
No
Your feedback is appreciated.