VCL Flow Chart Control
- 2 minutes to read
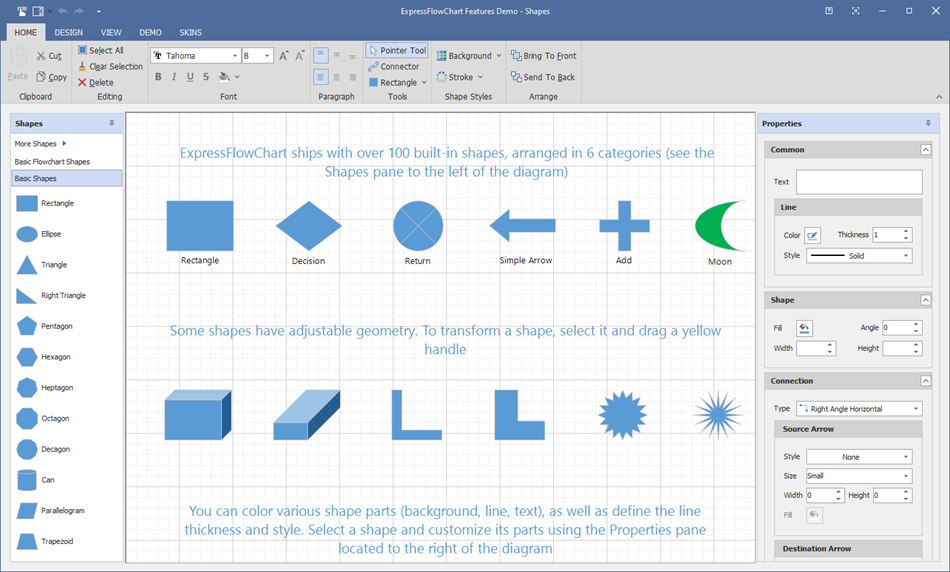
The VCL Flow Chart control includes various shapes that allow you to create charts and diagrams. The control combines a diagram viewer with a full-featured end-user designer.
Refer to the following topic for step-by-step instructions on how to create a chart: ExpressFlowChart - Getting Started
Built-In and Custom XML-Based Shapes
The control’s repository includes the following XML-based shapes:
Refer to the following topics for more information on XML-based shapes:
Auxiliary Grid
You can enable the grid and reference elements that allow users to position, align, and resize chart elements more precisely.
Chart Element Options
Each chart consists of chart symbols and connections. A user can create, rearrange, and customize these elements.
Options include:
Chart symbol rotation
Auto-route mode for connections
Chart element antialiasing
Refer to the TdxFcObject and TdxFcConnection class descriptions for an extended list of available options.
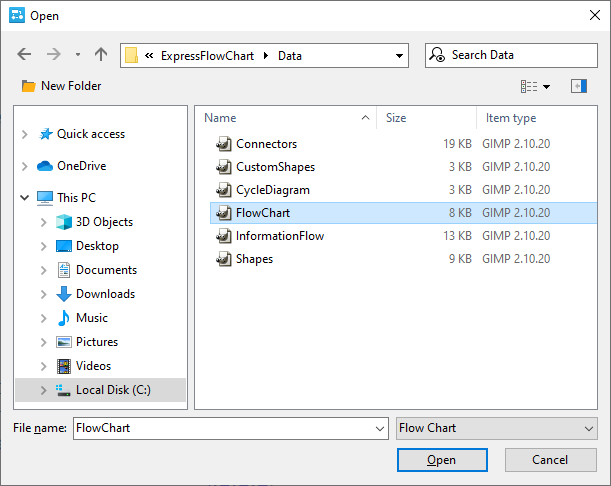
Chart Load and Save Options
You can load a chart from a file or stream and save the chart to a file or stream.
Built-In Chart Element Editors
The control includes the Ribbon-Based FlowChart Editor Dialog that allows users to customize a chart.
Refer to the following topic for more information on editor options: Built-In Chart Element Editors
Skin Support
You can apply skins to the control or use built-in look-and-feel settings.