TcxGridChartLineDiagram Class
A line diagram.
Declaration
TcxGridChartLineDiagram = class(
    TcxGridChartHistogram
)
Remarks
This class extends its ancestor class with members that allow you to do the following:
- Customize appearance settings (AxisCategory and Values).
- Configure styles specific to line diagram elements (Styles).
Note
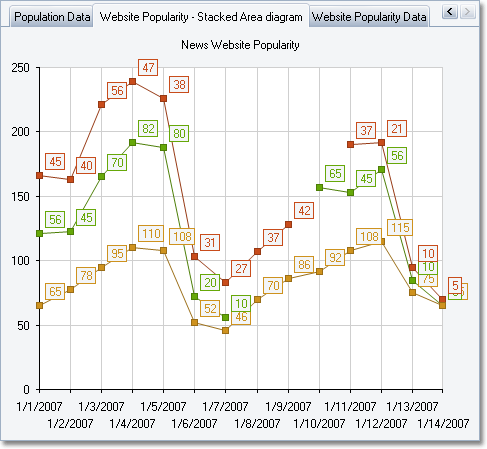
To plot a stacked line diagram, use the diagram’s Values.Stacking property to specify the required stacking type.
Inheritance
TObject
TPersistent
TcxGridChartDiagram
TcxGridChartHistogram
TcxGridChartLineDiagram
See Also