IChartSeries.Stack Property
Gets the Stack name to display it in the tooltip.
Namespace: DevExpress.Blazor
Assembly: DevExpress.Blazor.v22.1.dll
NuGet Package: DevExpress.Blazor
Declaration
string Stack { get; }Property Value
| Type | Description |
|---|---|
| String | The stack name. |
Remarks
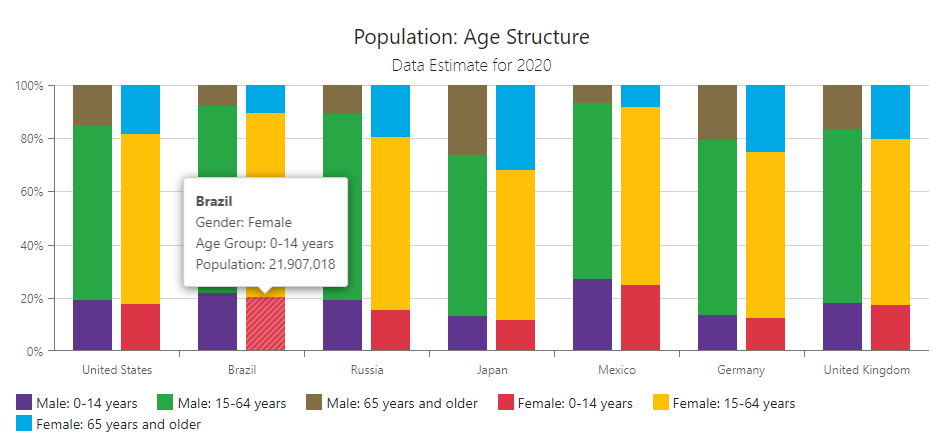
If your Chart contains a side-by-side stacked or full-stacked series, use the Stack property to display the Stack name in the tooltip.
The following example shows how to use the Stack property in the tooltip:
@inject IPopulationStructureDataProvider DataProvider

<DxChart T="PopulationAgeStructureItem"
         Data="@ChartsData"
         Width="100%">
    <DxChartTitle Text="Population: Age Structure">
        <DxChartSubTitle Text="Data Estimate for 2020" />
    </DxChartTitle>
    <DxChartCommonSeries T="PopulationAgeStructureItem"
                         TArgument="string"
                         TValue="int"
                         TGroup="string"
                         NameField='pasi => $"{pasi.Gender}: {pasi.AgeGroup}"'>
        <SeriesTemplate Context="settings">
            <DxChartFullStackedBarSeries Settings="@settings"
                                         ArgumentField="pasi => pasi.Country"
                                         ValueField="pasi => pasi.Population"
                                         Stack="@settings.Data.First().Gender" />
        </SeriesTemplate>
    </DxChartCommonSeries>
    <DxChartLegend HorizontalAlignment="HorizontalAlignment.Center"
                   VerticalAlignment="VerticalEdge.Bottom"
                   Position="RelativePosition.Outside" />
    <DxChartTooltip Enabled="true"
                    Position="RelativePosition.Outside">
        <div style="margin: 0.75rem">
            <div class="fw-bold">@context.Point.Argument</div>
            <div>Gender: @((context.Series as IChartSeries).Stack)</div>
            <div>Age Group: @(((PopulationAgeStructureItem)context.Point.DataItems.First()).AgeGroup)</div>
            <div>Population: @($"{context.Point.Value:N0}")</div>
        </div>
    </DxChartTooltip>
</DxChart>

@code {
    IEnumerable<PopulationAgeStructureItem> ChartsData;

    protected override async Task OnInitializedAsync() {
        ChartsData = await DataProvider.QueryData();
    }
}
See Also