DxChartAxisTick Class
Stores the appearance settings of major axis ticks.
Namespace: DevExpress.Blazor
Assembly: DevExpress.Blazor.v22.1.dll
NuGet Package: DevExpress.Blazor
Declaration
public class DxChartAxisTick :
    DxSettingsComponent<ChartAxisTickModel>
Remarks
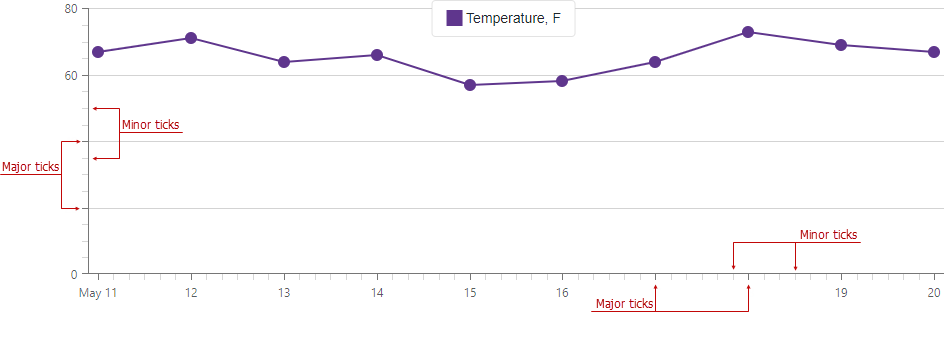
Major ticks divide an axis into sections that mark values on this axis. Minor ticks divide an axis segment between two neighboring major ticks. Minor ticks cannot be displayed on the axis of Discrete type.
Use the DxChartAxisTick class to customize appearance of major ticks and the DxChartAxisMinorTick class for minor ticks.
The Chart’s default axes show major ticks. Set the Visible property to false to hide them.
You can use the following properties to customize tick appearance:
- Color: Specifies the tick color.
- Opacity: Specifies the tick transparency.
- Shift: Shifts minor ticks relative to an axis line.
- Length: Specifies the tick length.
- Width: Specifies the tick width.
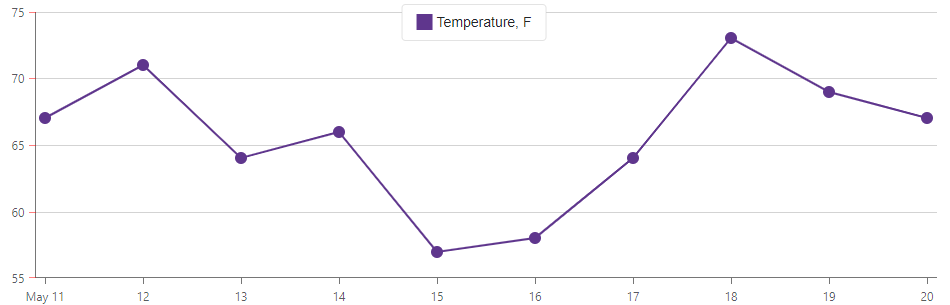
You should specify these properties in the component’s markup as shown in the snippet below:
@using Chart.Data
@using System.Drawing;

<DxChart Data="@forecasts">
    <DxChartLineSeries ArgumentField="@((WeatherForecast i) => i.Date)"
                       ValueField="@((WeatherForecast i) => i.TemperatureF)"
                       Name="Temperature, F" />
    <DxChartValueAxis>
        <DxChartAxisTick Color="Color.Red" Opacity="0.5" />
    </DxChartValueAxis>
</DxChart>
You can also use the following properties to specify how to position ticks on an axis:
- TickInterval: Specifies the interval between major ticks. Does not apply to discrete axes.
- DiscreteDivisionMode: Specifies whether ticks and grid lines lie between or next to axis labels.
- DivisionFactor: Specifies the minimum distance between two neighboring major ticks.
The following code snippet places grid lines and ticks next to axis labels (DiscreteDivisionMode="ChartDiscreteAxisDivisionMode.CrossLabels"):
<DxChart Data="@dataSource">
    <DxChartBarSeries Name="2017"
                      Filter="@((SaleInfo s) => s.Date.Year == 2017)"
                      ArgumentField="@(s => s.Region)"
                      ValueField="@(s => s.Amount)"
                      SummaryMethod="Enumerable.Sum" />
    <DxChartBarSeries Name="2018"
                      Filter="@((SaleInfo s) => s.Date.Year == 2018)"
                      ArgumentField="@(s => s.Region)"
                      ValueField="@(s => s.Amount)"
                      SummaryMethod="Enumerable.Sum" />
    <DxChartBarSeries Name="2019"
                      Filter="@((SaleInfo s) => s.Date.Year == 2019)"
                      ArgumentField="@(s => s.Region)"
                      ValueField="@(s => s.Amount)"
                      SummaryMethod="Enumerable.Sum" />
    <DxChartArgumentAxis Type="ChartAxisType.Discrete"
                         DiscreteDivisionMode="ChartDiscreteAxisDivisionMode.CrossLabels" />
    <DxChartLegend Position="RelativePosition.Outside" HorizontalAlignment="HorizontalAlignment.Right" />
</DxChart>
