DxChartScaleBreak Class
Contains settings for the scale breaks.
Namespace: DevExpress.Blazor
Assembly: DevExpress.Blazor.v22.1.dll
NuGet Package: DevExpress.Blazor
Declaration
public class DxChartScaleBreak :
    DxSettingsComponent<ChartScaleBreakModel>
Remarks
A scale break allows you to cut a part of the axis to improve the readability of a chart with high amplitude values or outliers. You can specify as many breaks as required.
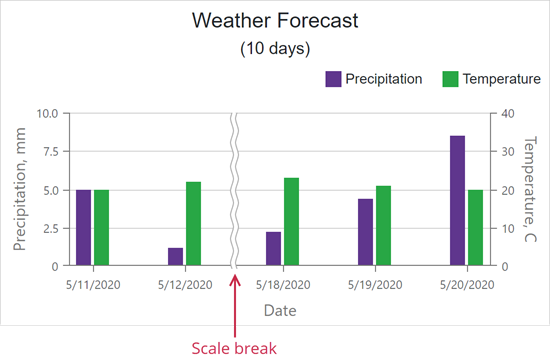
Use the StartValue and EndValue properties to limit a scale break. A scale break is visible only if its range exceeds the tick interval.
<DxChart Data="@SalesData">
    <DxChartArgumentAxis>
        <DxChartScaleBreak StartValue="@(new DateTime(2017, 01, 04))" EndValue="@(new DateTime(2017, 04, 04))" />
    </DxChartArgumentAxis>
    <DxChartValueAxis>
        <DxChartScaleBreak StartValue="50" EndValue="200" />
    </DxChartValueAxis>
    @* ... *@
</DxChart>
The value axis supports auto-calculated scale breaks, which can be enabled by setting the AutoBreaksEnabled option to true.
<DxChart Data="@SalesData">
    <DxChartValueAxis AutoBreaksEnabled="true" >
      @* ... *@
    </DxChartValueAxis>
</DxChart>
Inheritance
Object
ComponentBase
DxSettingsComponent<DevExpress.Blazor.Internal.ChartScaleBreakModel>
DxChartScaleBreak
See Also