DxChartSeriesLabel Class
Provides settings for series labels.
Namespace: DevExpress.Blazor
Assembly: DevExpress.Blazor.v22.1.dll
NuGet Package: DevExpress.Blazor
Declaration
public class DxChartSeriesLabel :
    DxComplexSettingsComponent<DxChartSeriesLabel, ChartSeriesLabelModel>,
    IModelProvider<ChartSeriesLabelConnectorModel>
Remarks
Use the DxChartSeriesLabel component to show and configure labels for series data points. The specified settings apply to all the labels in the series.
To override settings of individual labels, handle the chart’s CustomizeSeriesPoint event and use the event argument’s PointLabel property. You can also use the FormatPattern property to specify the label’s format.
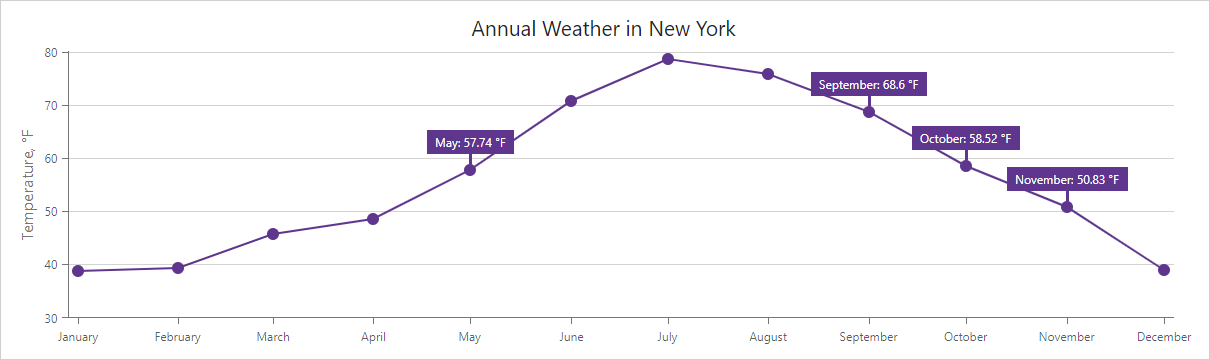
The following example demonstrates how to:
- define the label position at the series level;
- show only labels whose values are between 25 and 75;
- use the DxChartSeriesLabelConnector component to customize connectors between data points and labels.
@inject IWeatherSummaryDataProvider WeatherSummaryDataProvider
<DxChart Data="@WeatherForecasts"
         CustomizeSeriesPoint="@PreparePointLabel"
         Width="100%">
    <DxChartLineSeries SummaryMethod="@(i => i.Average())"
                       ValueField="@((DetailedWeatherSummary i) => i.AverageTemperatureF)"
                       ArgumentField="@(i => new DateTime(2000, i.Date.Month, 1))"
                       Name="Temperature, F"
                       Filter="@((DetailedWeatherSummary  i) => i.City == "NEW YORK")">
        <DxChartSeriesLabel Position="RelativePosition.Outside"
                            FormatPattern="{argument:MMMM}: {value:#.##} °F">
            <DxChartSeriesLabelConnector Visible="true"
                                         Width="3" />
        </DxChartSeriesLabel>
    </DxChartLineSeries>
</DxChart>

@code {
    IEnumerable<DetailedWeatherSummary> WeatherForecasts;
    protected override async Task OnInitializedAsync() {
        WeatherForecasts = await WeatherSummaryDataProvider.GetDataAsync();
    }
    protected void PreparePointLabel(ChartSeriesPointCustomizationSettings pointSettings) {
        double value = (double)pointSettings.Point.Value;
        if (value > 50 && value < 70)
            pointSettings.PointLabel.Visible = true;
    }
}
Inheritance
See Also