DxChartStackedSplineAreaSeries<T, TArgument, TValue> Class
Defines a stacked spline area series.
Namespace: DevExpress.Blazor
Assembly: DevExpress.Blazor.v22.1.dll
NuGet Package: DevExpress.Blazor
Declaration
public class DxChartStackedSplineAreaSeries<T, TArgument, TValue> :
    DxChartAreaSeriesBase<T, TArgument, TValue>
Type Parameters
| Name | Description |
|---|---|
| T | The type of data. |
| TArgument | The type of series arguments. |
| TValue | The type of series values. |
Remarks
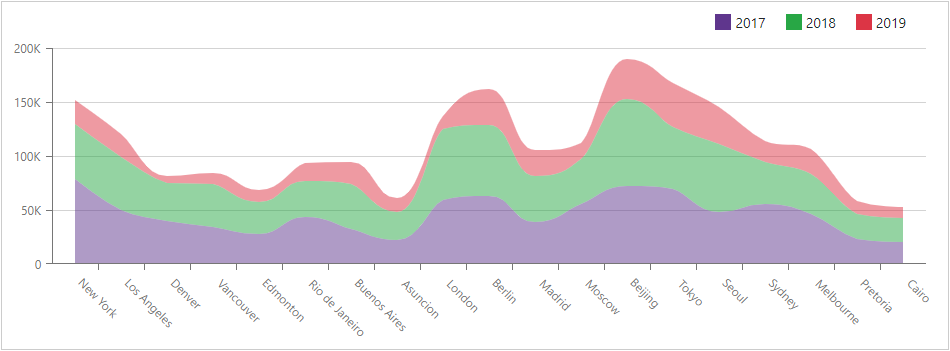
The stacked spline area series displays data as a spline interpolation of the series values. The area between the spline and the argument axis (or a lower series) is shaded with a color. Different series do not overlap because their values are stacked.
Use the chart’s Data property to specify an IEnumerable<T> data source, and the ArgumentField and ValueField properties to specify data source fields that contain arguments and values for chart points. For a sample data source, refer to our GitHub repository.
<DxChart Data="@SalesData">
    <DxChartStackedSplineAreaSeries Name="2017"
                                    Filter="@((SaleInfo s) => s.Date.Year == 2017)"
                                    ArgumentField="@(s => s.City)"
                                    ValueField="@(s => s.Amount)"
                                    SummaryMethod="Enumerable.Sum" />
    <DxChartStackedSplineAreaSeries Name="2018"
                                    Filter="@((SaleInfo s) => s.Date.Year == 2018)"
                                    ArgumentField="@(s => s.City)"
                                    ValueField="@(s => s.Amount)"
                                    SummaryMethod="Enumerable.Sum" />
    <DxChartStackedSplineAreaSeries Name="2019"
                                    Filter="@((SaleInfo s) => s.Date.Year == 2019)"
                                    ArgumentField="@(s => s.City)"
                                    ValueField="@(s => s.Amount)"
                                    SummaryMethod="Enumerable.Sum" />
    <DxChartLegend Position="RelativePosition.Outside" HorizontalAlignment="HorizontalAlignment.Right" />
</DxChart>

@code {